Explainable paroxysmal atrial fibrillation diagnosis using an artificial intelligence-enabled electrocardiogram
Article information

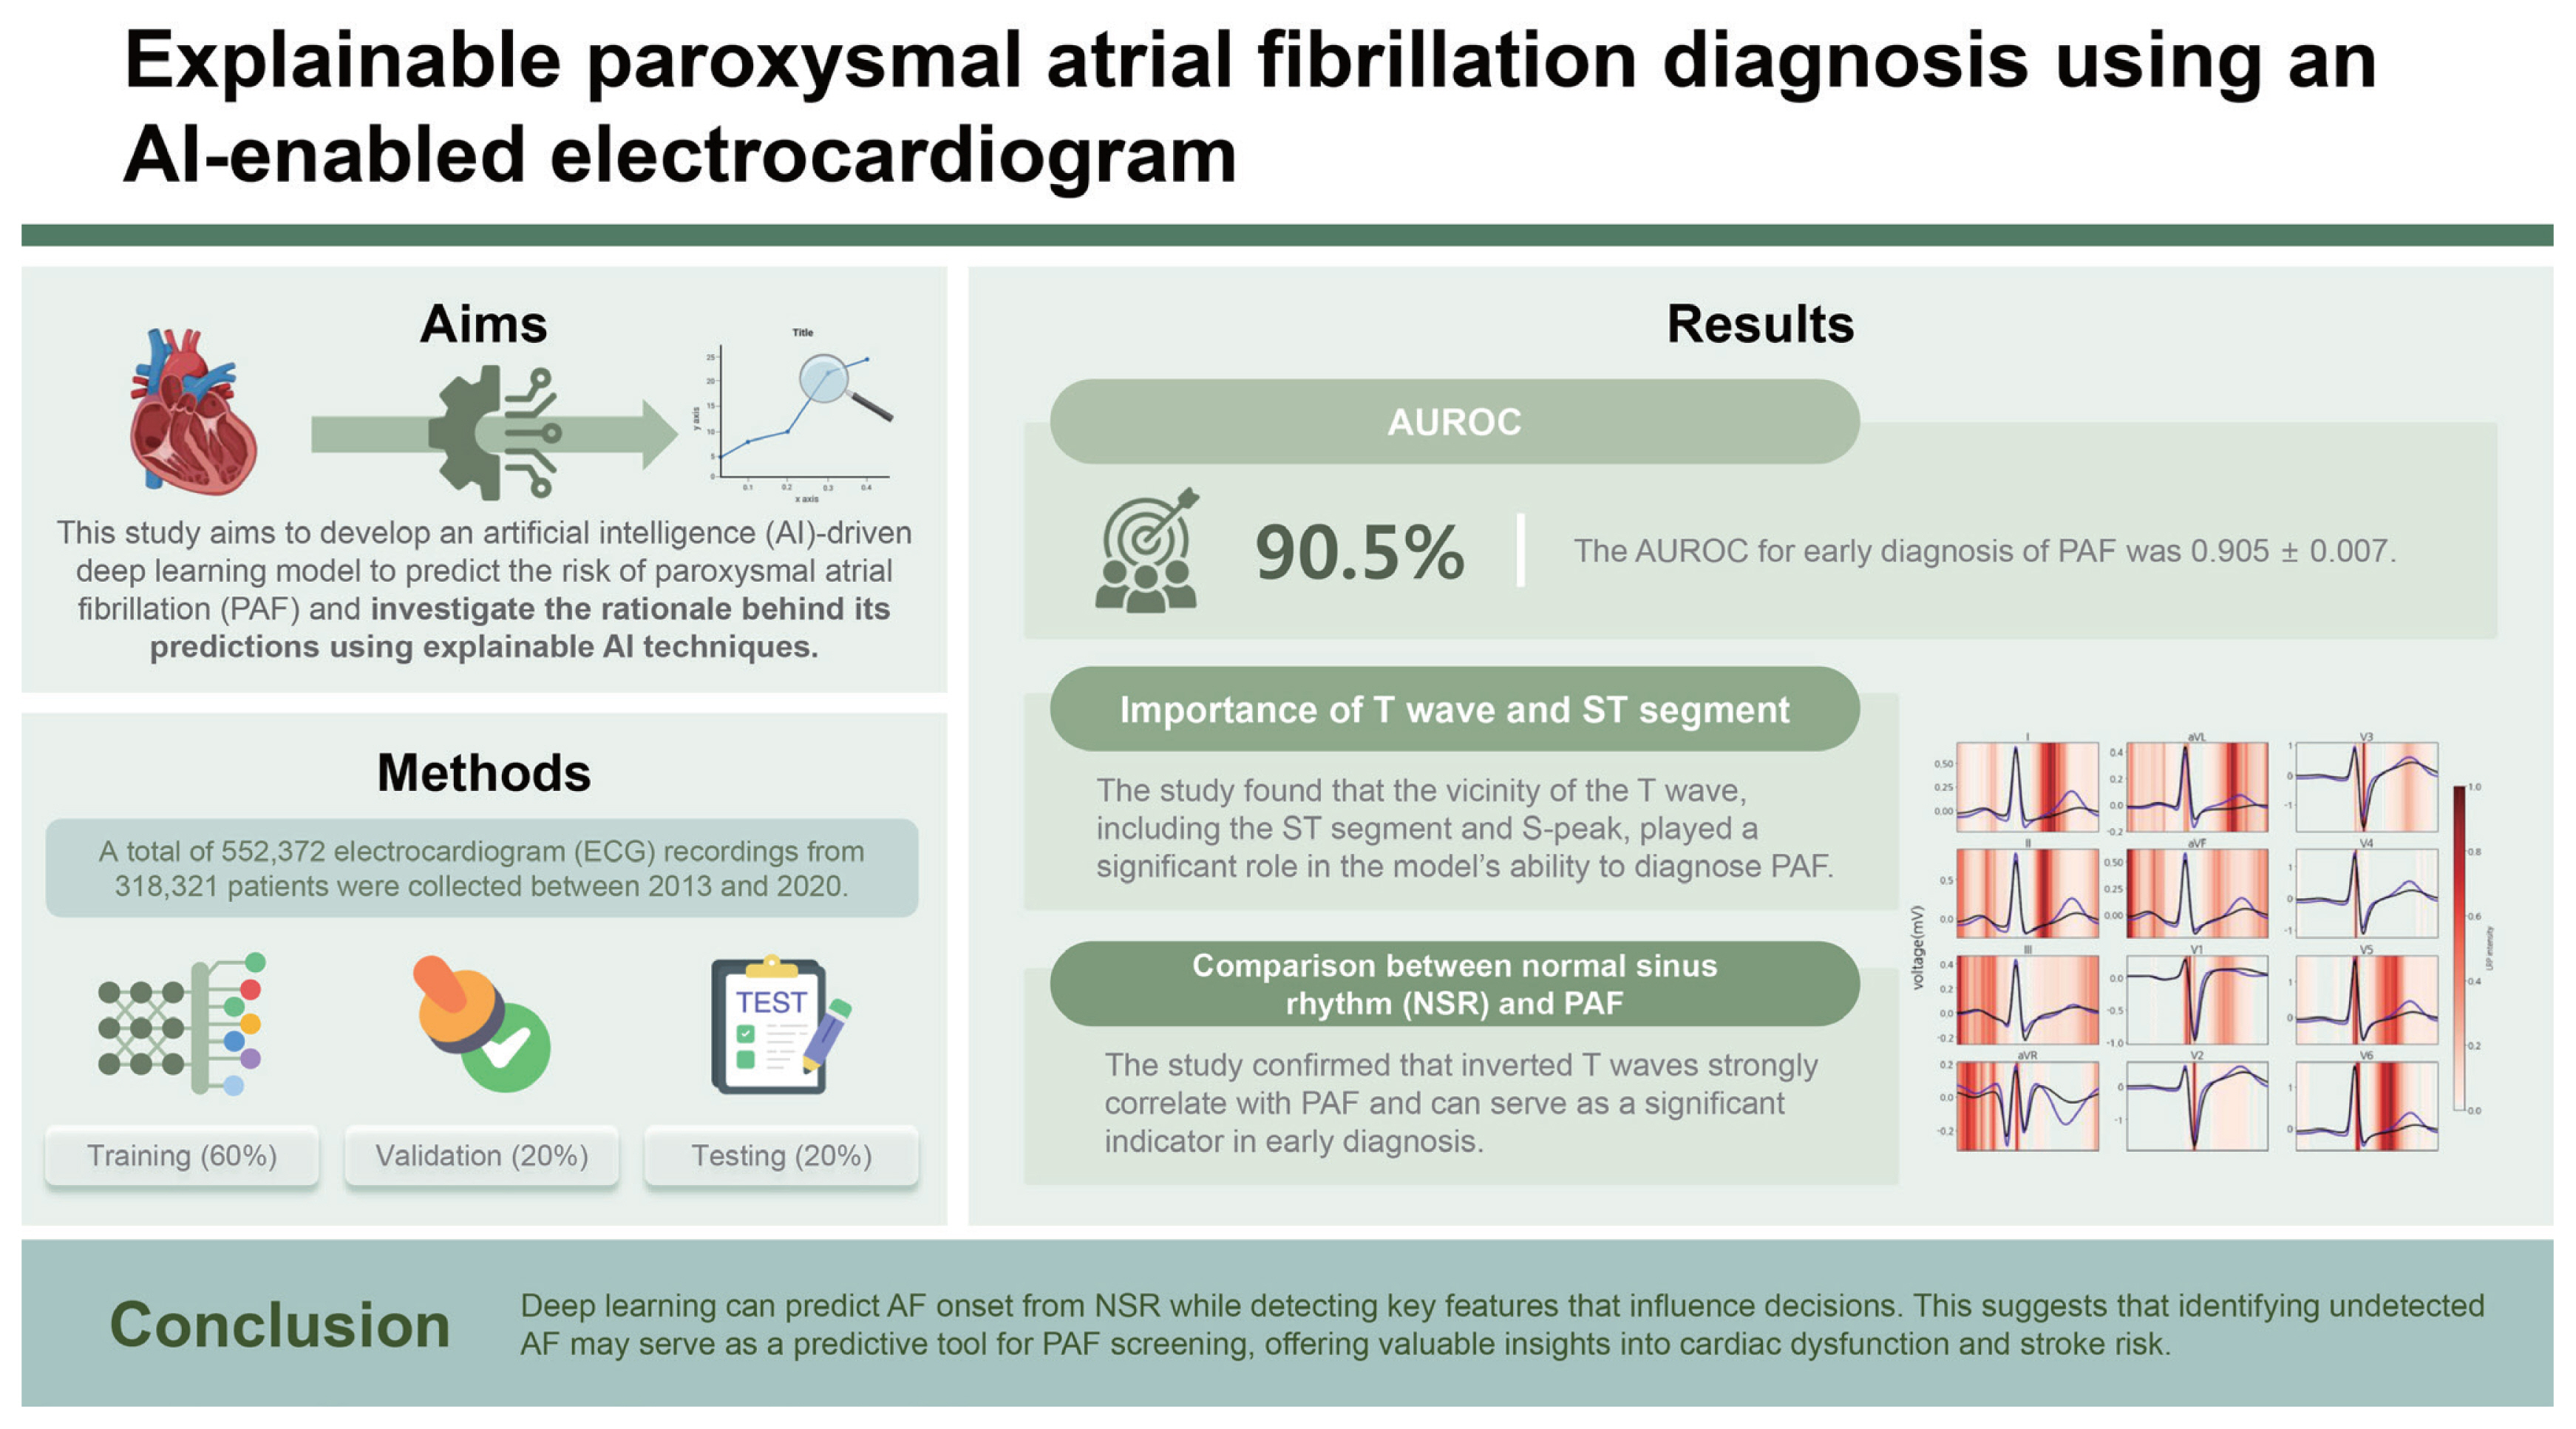
Abstract
Background/Aims
Atrial fibrillation (AF) significantly contributes to global morbidity and mortality. Paroxysmal atrial fibrillation (PAF) is particularly common among patients with cryptogenic strokes or transient ischemic attacks and has a silent nature. This study aims to develop reliable artificial intelligence (AI) algorithms to detect early signs of AF in patients with normal sinus rhythm (NSR) using a 12-lead electrocardiogram (ECG).
Methods
Between 2013 and 2020, 552,372 ECG traces from 318,321 patients were collected and split into training (n = 331,422), validation (n = 110,475), and test sets (n = 110,475). Deep neural networks were then trained to predict AF onset within one month of NSR. Model performance was evaluated using the area under the receiver operating characteristic curve (AUROC). An explainable AI technique was employed to identify the inference evidence underlying the predictions of deep learning models.
Results
The AUROC for early diagnosis of PAF was 0.905 ± 0.007. The findings reveal that the vicinity of the T wave, including the ST segment and S-peak, significantly influences the ability of the trained neural network to diagnose PAF. Additionally, comparing the summarized ECG in NSR with those in PAF revealed that nonspecific ST-T abnormalities and inverted T waves were associated with PAF.
Conclusions
Deep learning can predict AF onset from NSR while detecting key features that influence decisions. This suggests that identifying undetected AF may serve as a predictive tool for PAF screening, offering valuable insights into cardiac dysfunction and stroke risk.
INTRODUCTION
Atrial fibrillation (AF), a prevalent form of arrhythmia, is associated with severe cardiovascular conditions and stands as a leading cause of mortality and morbidity [1,2]. AF significantly contributes to ischemic stroke associated with thromboembolism, a risk that anticoagulation can effectively prevent [3–8]. Nonetheless, AF often progresses without any clinical manifestation. Therefore, early detection and diagnosis of AF from normal conditions could support a comprehensive management system, potentially improving survival rates and alleviating disease burden.
Electrocardiogram (ECG) is the most widely used method for cardiovascular diagnostics and can offer significant prognostic insights [9]. However, screening for AF remains challenging, as many patients exhibit paroxysmal and asymptomatic features [1,2,10–12]. Although intermittent ECG screening or opportunistic pulse palpation provides a common, cost-effective approach to detect AF, several cases go undetected, and identifying the prevalence of AF poses a more fundamental issue than the choice of a screening strategy [13–15] Certain features of ECG, especially P waves, are often used to diagnose early AF [16–18]. However, they lack sufficient probability to be clinically useful in statistical models [7]. Machine learning algorithms, such as deep neural networks, can address these limitations by uncovering intricate patterns within large-scale datasets, and they demonstrate effectiveness in tasks including early AF detection and ECG classification [19–23].
Deep learning approaches advance beyond traditional pattern-based methods to detect paroxysmal atrial fibrillation (PAF) [6–8]. When these models are trained, probabilistically distinguishing PAF by learning data features from large ECG datasets is possible. However, studies show that the current deep learning systems prioritize reducing prediction errors over providing the significance of features or explaining what drives the networks [7,8]. This focus limits their operational usefulness and reduces the reliability of deep learning outputs in healthcare.
Therefore, this study aims to develop an artificial intelligence (AI) model to distinguish subtle patterns in a standard 12-lead ECG that are imperceptible to the human eye. To test this, we trained a deep neural network using a large cohort of patients from a tertiary hospital. Additionally, we interpreted the inference engine of the model to uncover the basis of its decisions.
METHODS
Data sources and study population
We extracted standard 12-lead ECGs for patients with at least one instance of normal sinus rhythm (NSR) recorded between May 16, 2013 and December 31, 2020. Each ECG was captured at a 500 Hz sampling rate, with raw data stored in the MUSE cardiology information system (GE Healthcare, Chicago, IL, USA).
The extracted ECG data included 10-s recordings. The quantitative measurements from ECG clinical reports were analyzed to identify diagnostic class and 18 patient features. These features were age, sex, ventricular/atrial rate, QRS duration/count, QTc (Bazett/Fridericia correction), QT interval, PR interval, the axes of P, R, and T waves, T-offset and on/offset of P and Q. Each variable had a missing value rate of 0–24.7%, with the highest percentage being sex. For cases with missing values, due to reasons such as privacy constraints, we imputed values to denote the absence of information.
In the prepared data, we excluded 95,398 ECGs where patient ID was not tracked and 287,247 ECGs where diagnostic classification was unavailable for AF or NSR. Rhythm diagnosis and labeling were carefully performed by clinical experts to ensure reliability before further analysis. These annotations were further validated using the electronic medical records of the patients, cross-referencing for AF diagnosis codes or documented history. Only AF diagnosis codes or previous history without a documented 12-lead ECG were not classified as PAF.
In the ECG clinical report of a patient, NSR recorded within 31 days following the first AF episode was labeled as “PAF.” This broader definition, extending beyond the standard definition of PAF (AF episodes lasting under 7 days without intervention), enabled a comprehensive assessment of early AF episodes. The ECGs recorded more than 31 days after the first AF episode and those taken before the first onset were excluded. ECGs with consistent NSR across clinical records were annotated as ‘Normal.’ After annotation, we categorized patients into PAF and control groups and then deidentified the ECG data to remove personal ID. This approach ensured that subtle ECG patterns related to PAF were robustly identified, independent of individual characteristics.
We initially extracted 1,014,617 raw ECGs from 422,664 patients. From these, 95,398 ECGs with incomplete PID tracking or missing data were excluded, as well as 287,247 ECGs without AF records or NSR. Additionally, sinus rhythm ECGs immediately preceding the first AF event were excluded to avoid recording transitional ECG patterns that may not accurately reflect the early characteristics of PAF [7], thereby reducing noise and enhancing model prediction accuracy. ECGs were annotated as normal if all serial recordings for a patient showed NSR, while ECG records within the target window were labeled as PAF. After applying certain exclusions (Fig. 1), the dataset included 552,372 ECGs from 318,321 patients. Applying predefined labeling protocol, 26,541 ECGs (4.8%) were annotated as PAF, reflecting similar prevalence rates in the general population [24]. The processed ECGs were divided into training (60%), validation (20%), and test datasets (20%) for model training.
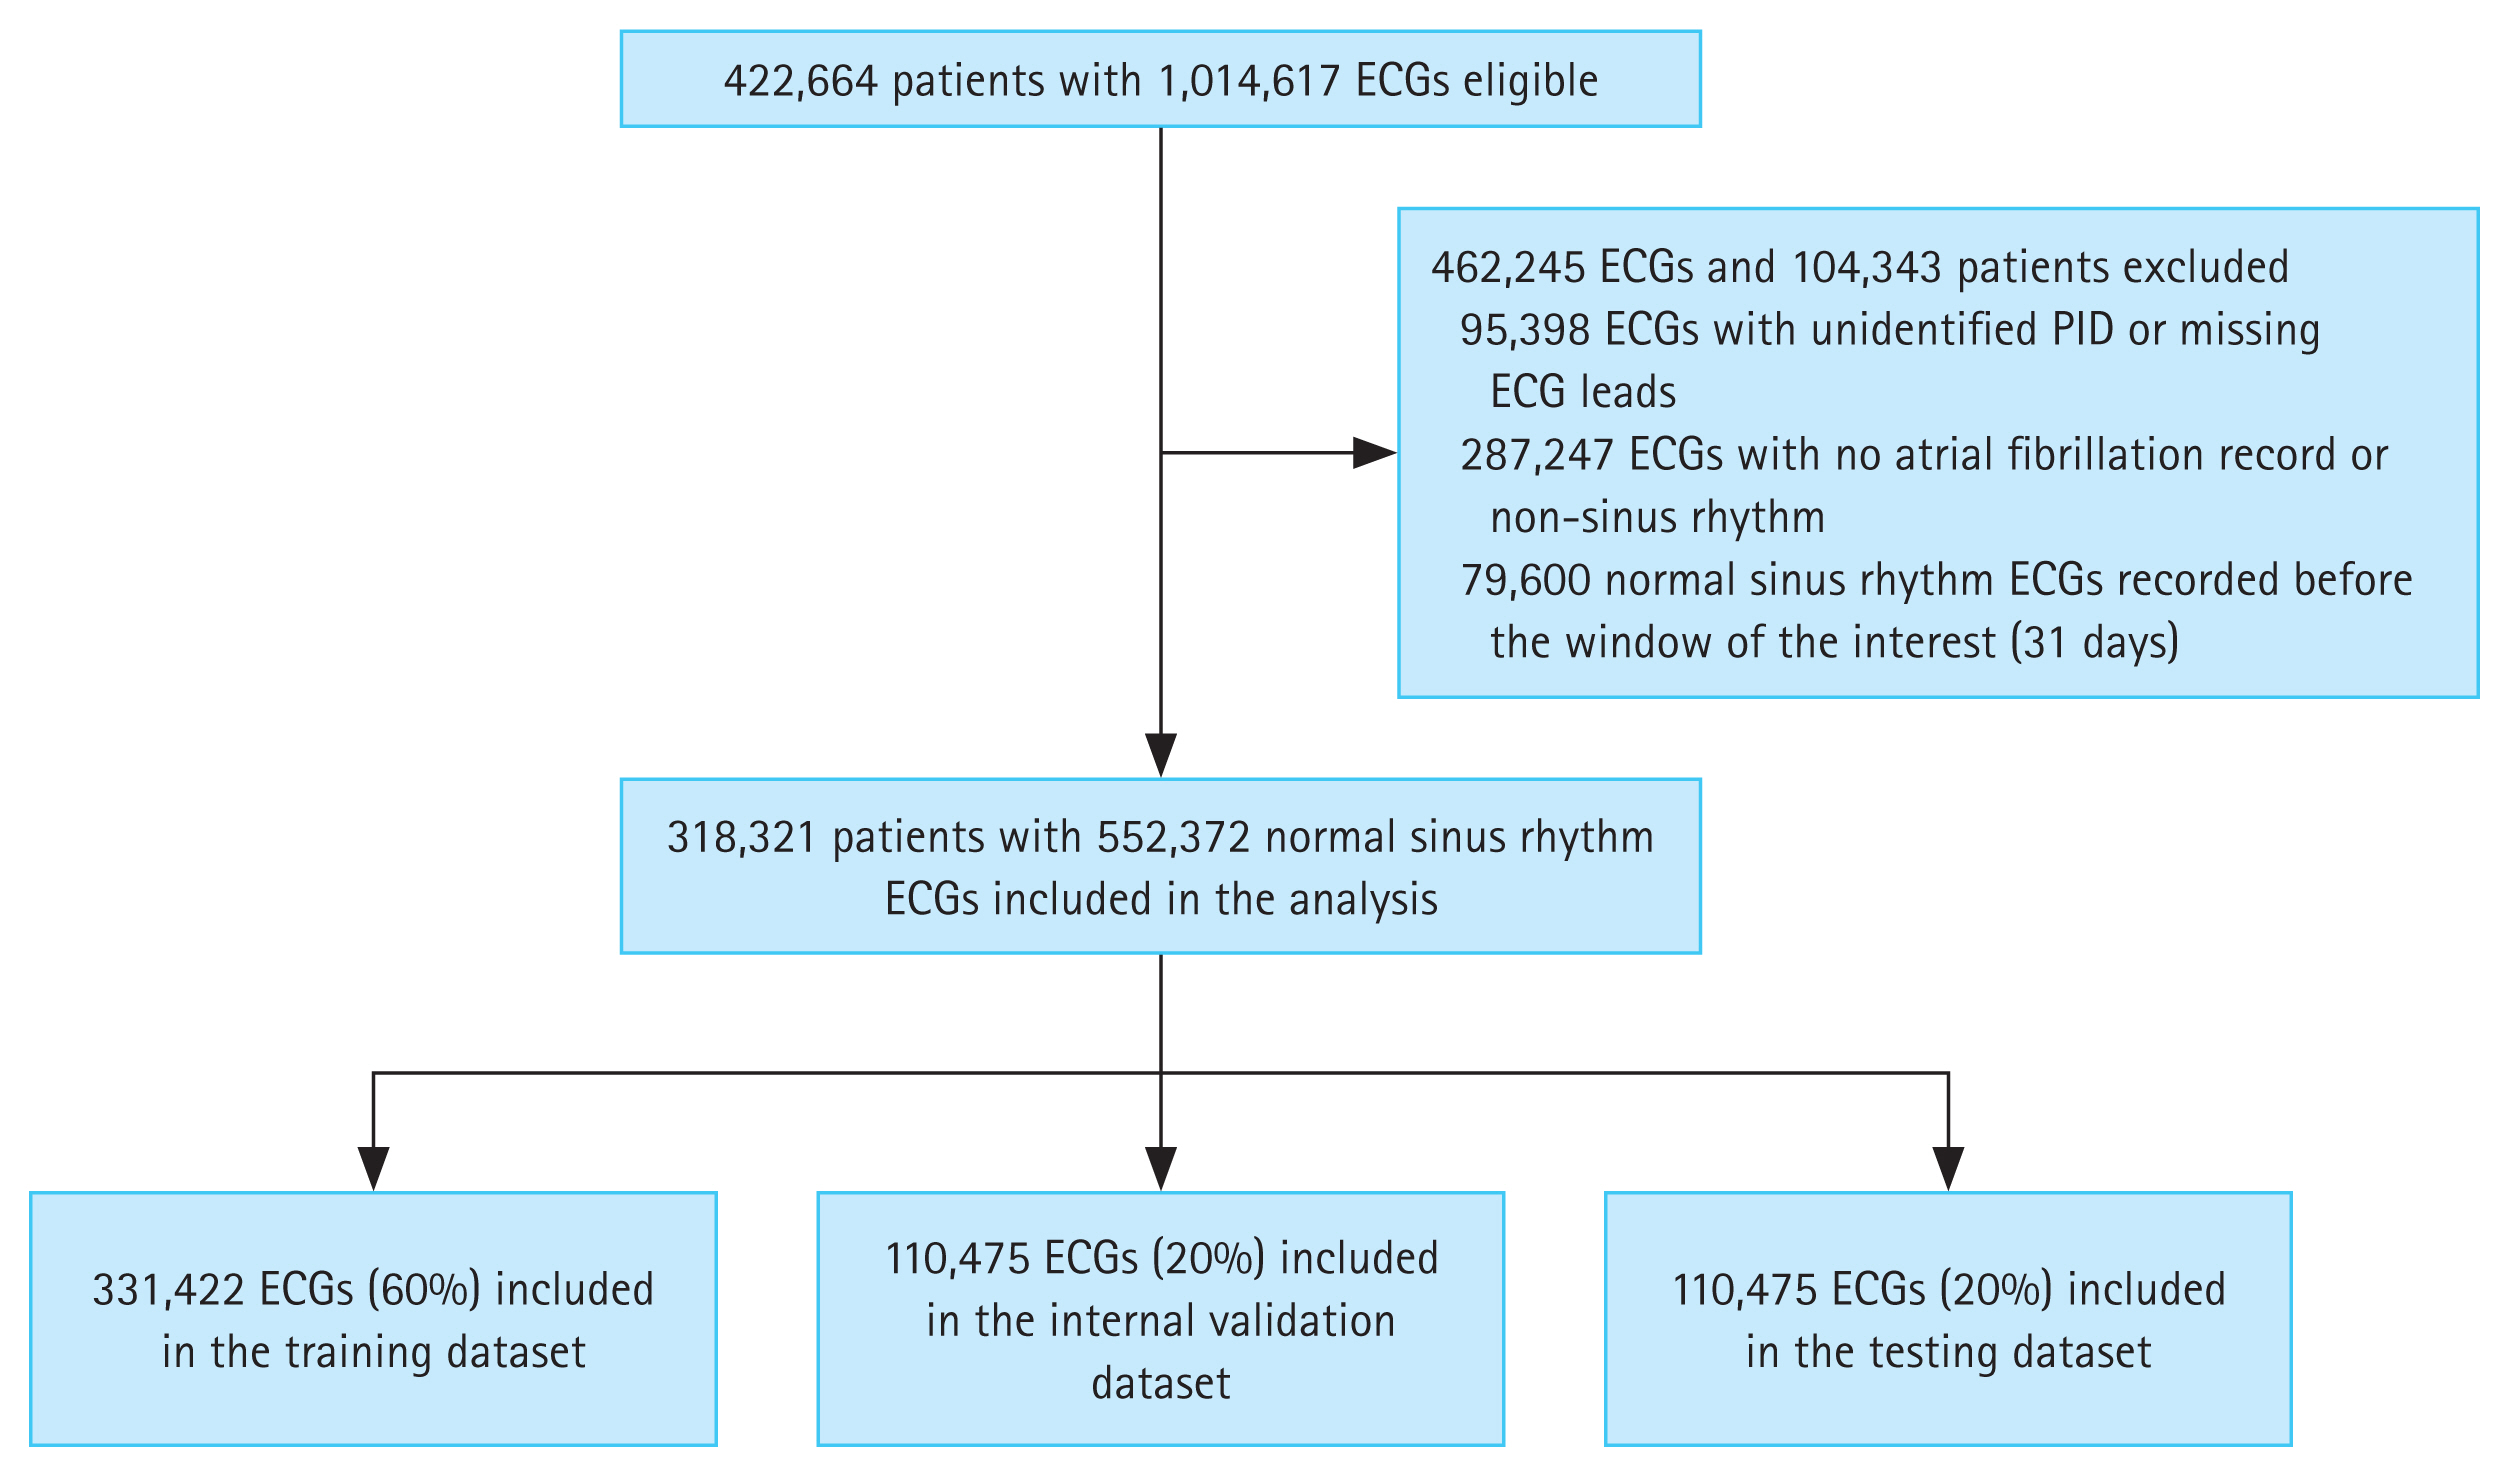
Summary of data used in the study. Diagram summarizing patient selection for training, validation, and testing cohorts. ECG, electrocardiogram; PID, patient identification.
Algorithm development and evaluation for PAF early detection
The convolutional neural network (CNN)-based statistical model for early PAF detection was developed using patient demographics and raw ECG data as input. The CNN model was designed to identify patterns and extract local spatial features from global maps using filters that apply each input subregion through dot product operations [25]. Given the seasonality and fixed length of ECG signals, 1d-CNN is the most appropriate to apply [26]. The network architecture for analyzing standard 12-lead ECGs (sampled at 500 Hz) included 50 convolutional layers, using the skip-connection method of the residual network [27] to ensure effective training. The model we used consisted of 16 residual blocks, each containing three convolution layers, followed by a Batch Normalization and rectified linear activation function (ReLU) applied after each layer [28,29]. Where the output feature map dimensions decrease, a convolutional layer with a stride of 2 was applied to ensure alignment between input and output dimensions. Pooling was conducted at the first and last layers after the nonlinear activation function. A feature vector was then extracted from the ECG by applying two fully connected (FC) layers with ReLU activations. Finally, this feature vector was concatenated with a 12-lead ECG feature vector, which produced class probabilities via a final FC layer and softmax function. The network weights were initialized following the He method, and the model was optimized using the Adam algorithm with default parameters β1 = 0.9 and β2 = 0.999 [30,31]. The batch size was 32, with a learning rate of 1 × 10⁻⁴, halved every 10 epochs. Figure 2 depicts the overall architect of our model.
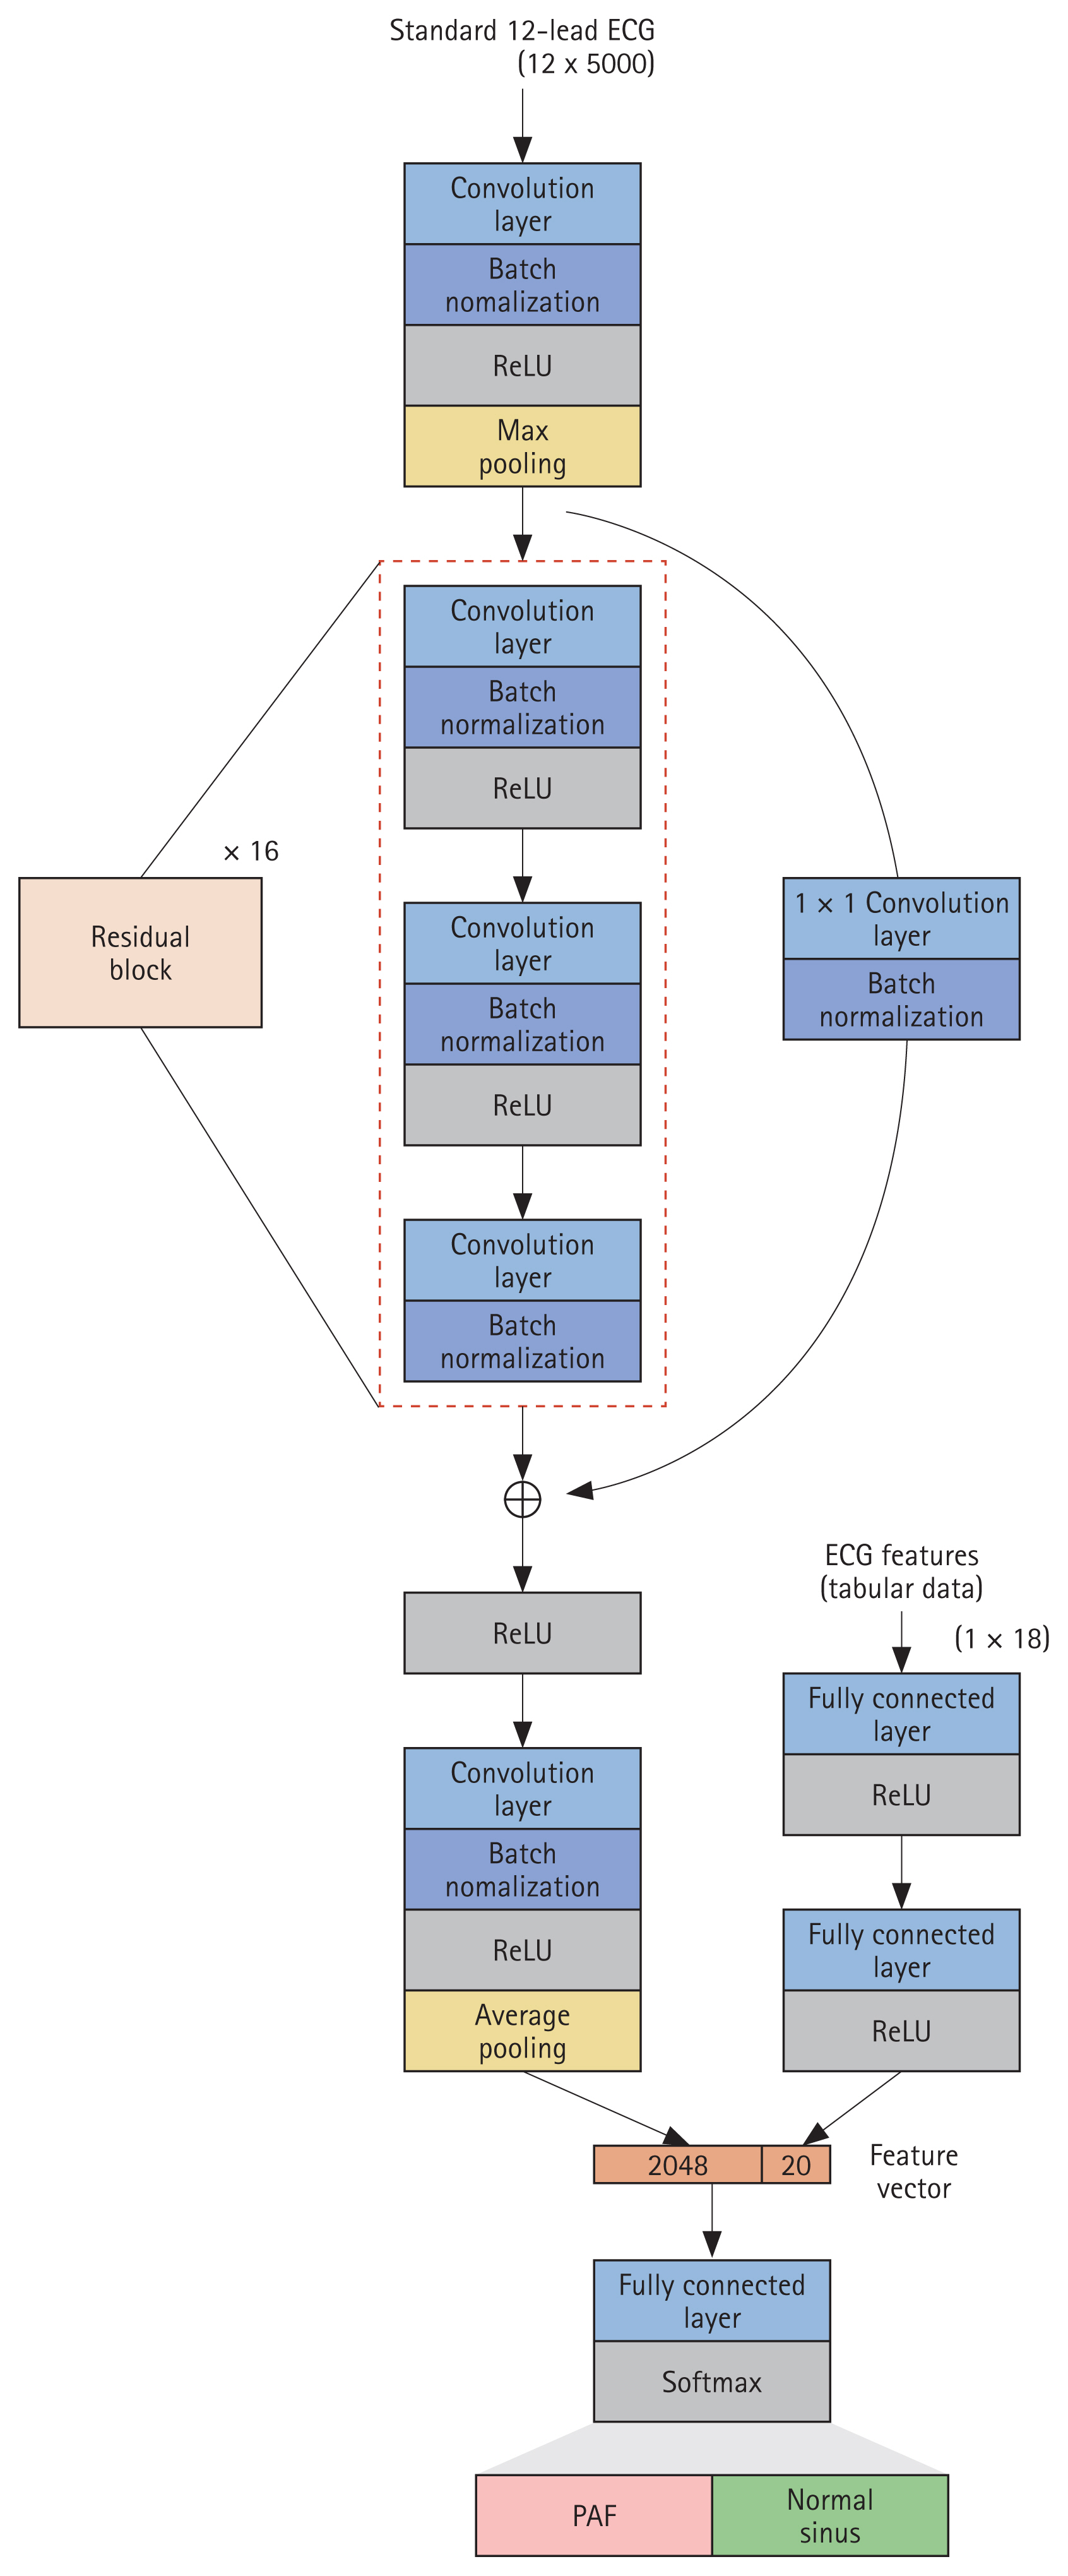
Network architecture. Network architecture used in the study. Our network processes raw ECG data (sampled at 500 Hz) and ECG features to predict AF onset within a month. ECG, electrocardiogram; ReLU, rectified linear activation function; PAF, paroxysmal atrial fibrillation; AF, atrial fibrillation.
Additionally, focal loss was used to address data imbalance. This loss function—a variation of cross entropy—counteracts extreme interclass imbalances by assigning lower weights to easily classified negatives to reduce their contribution to learning while increasing weights for challenging positives that are harder to classify [32]. Hyperparameters for the network structure and loss function used were set through grid search and manual tuning.
We trained 30 models using different dataset configurations generated through pseudo-random number sampling. The model performance was evaluated using the area under the curve (AUC) metric, a key performance indicator in binary classification where a higher AUC indicates better performance. To further evaluate the generalizability and stability of the model, we recorded the AUC of the developed models.
Identify contributors to PAF early detection through LRP
The interpretability of complex deep-learning models remains a major concern in the medical field. Enhancing model transparency can improve acceptance in clinical decision-making and justify specific diagnoses and treatment recommendations [33]. Layer-wise relevance propagation (LRP) is a prominent method for interpreting complex deep-learning models by measuring the contribution of each input to the output of the model [34]. It functions by estimating and decomposing the layer-level contributions presenting relevance scores for input features as a heatmap. We calculated the relevance score of each input value by backpropagating from the class score of the output node to the input layer, scaling values between 0 and 1 across all leads. This produced a scaled relevance score for each input dimension. To elucidate factors influencing early PAF diagnosis, we interpreted LRP from the following perspectives: leads and intervals. Lead contributions were identified by averaging relevance scores for each lead across classifications. To maintain consistency and facilitate model interpretation, the ECG summary process was referenced and applied to relevance scores. Next, the ECG intervals were confirmed by summarizing key ECG measurements obtaining the average value of the relevance score for each interval.
Ethics statement
The Institutional Review Board of Chonnam National University Hospital approved this study with a waiver of consent (CNUH-2021-158), adhering to institutional patient privacy policies.
RESULTS
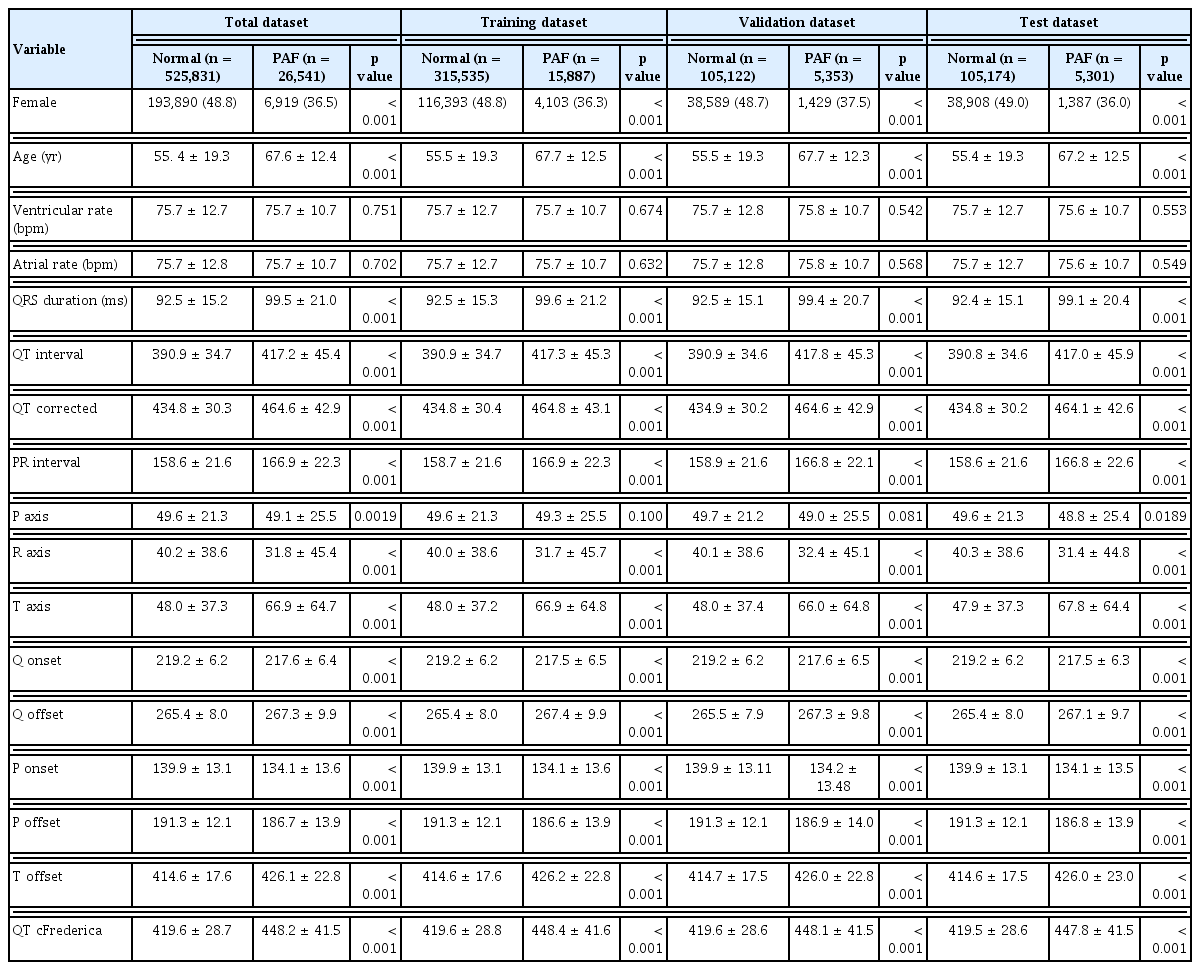
In the training, validation, and test datasets, age and sex distributions were similar between the PAF and normal groups. Table 1 presents the patient characteristics for PAF and normal groups across each dataset. Categorical variables are shown as absolute numbers or percentages, while continuous variables are reported as mean ± standard deviation. Categorical and continuous variables were compared using the chi-square test and Student’s t-test, respectively.
Comparison of patient characteristics
Model training involved 331,422 ECGs, with a mean patient age of 55.9 ±19.2 years at the date of the ECG recording. Of these, 129,342 (51.8%) ECGs were from male patients, and 15,887 (4.8%) were labeled as PAF. The internal validation set included 110,475 ECGs, with a mean age of 55.9 ±19.2 years; 43,098 (51.9%) were male, and 5,353 (4.8%) were PAF cases. The test dataset also included 110,475 ECGs, with a mean age of 55.7 ±19.2 years; 42,880 (51.6%) were male, and 5,301 (4.8%) were PAF cases. Cases lacking age (n = 64,587; 11.7%) and sex information (n = 136,243; 24.7%) were treated as noise during model training.
Evaluation of model performance
The limited number of positive cases required for effective training was a critical barrier when applying deep learning to diagnose PAF. To address this class imbalance, we employed focal loss as a loss function of CNN. This technique reduces the influence of easy negative cases while assigning greater weight to hard positive cases, thereby enhancing model accuracy. Here, we implemented a CNN model that inputs ECG data with features such as age, sex, and ECG parameters. Model performance was evaluated using the area under the curve of the receiver operating characteristic curve (AUROC). To understand the generalizability and stability of the model, 30 datasets were generated through pseudo-random sampling and trained individually against the corresponding test dataset. The performance results showed a sensitivity, specificity, and F1 score of 0.722 ± 0.015, 0.906 ± 0.006, and 0.542 ± 0.011, respectively. The AUC for early PAF diagnosis was 0.905 ± 0.007. Class-specific predictive accuracy was 0.826 ± 0.011 for negative cases (Fig. 3, blue) and 0.702 ± 0.019 for the positive cases (Fig. 3, red).
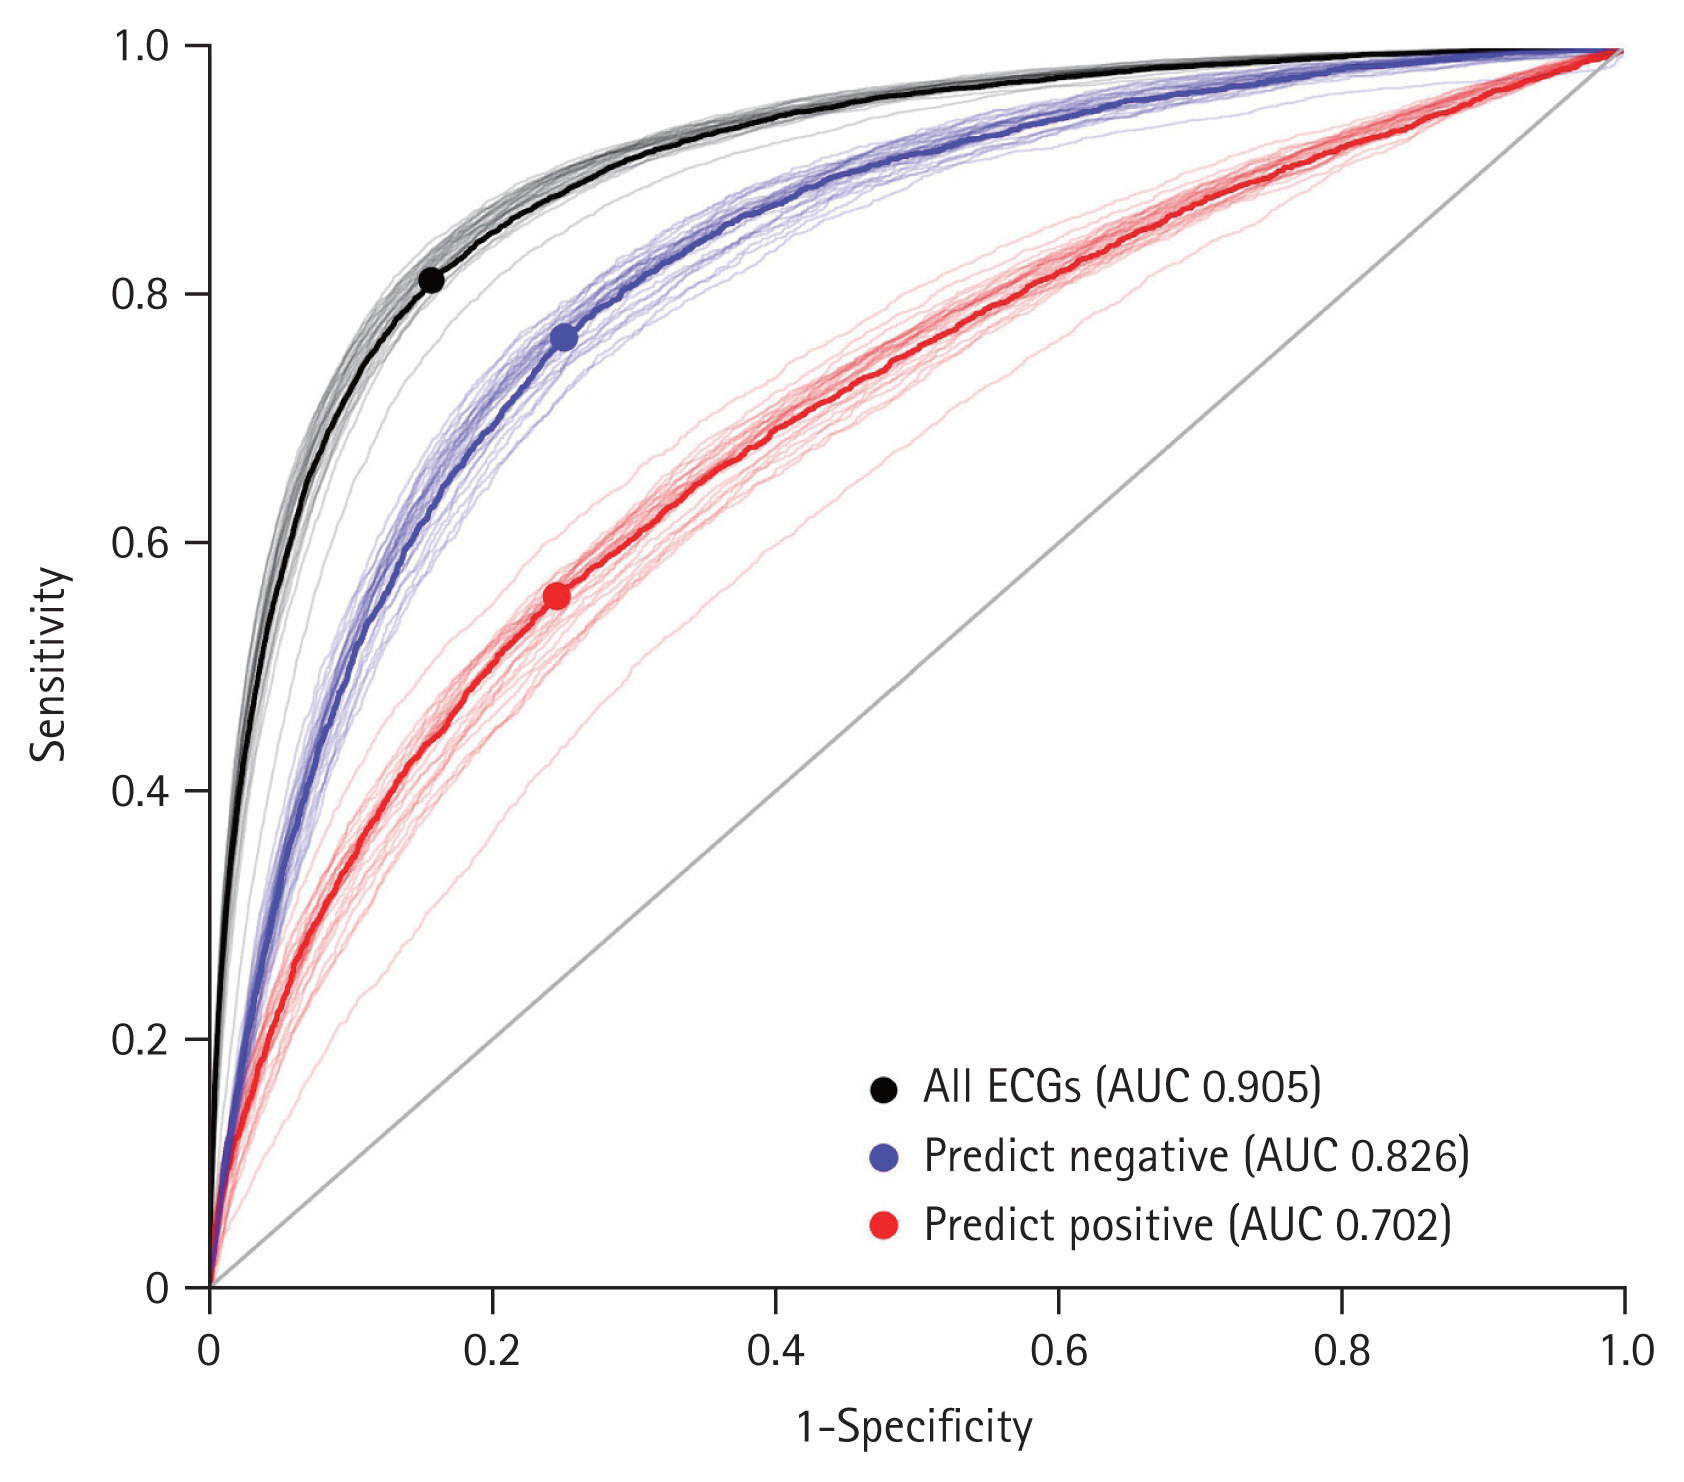
Model performance. ROC curves of the trained model for all data (black), negative prediction ECG subset (blue), and positive prediction ECG subset (red). ECG, electrocardiogram; AUC, area under the curve; ROC, receiver operating characteristic.
Interpreting the inference process of the deep learning model
Although our model showed strong performance in diagnosing PAF using large-scale data, interpreting the inference process of the deep learning model remains challenging. We used the LRP method to explore the ECG leads and intervals that affected PAF prediction. The P wave is clinically known to affect the diagnosis of PAF [18,21,35,36]. We hypothesized that critical factors could influence prediction more subtly, which could be revealed by analyzing ECG contribution.
To explain the deep learning explanation technique on ECG records, we used the LRP method to identify key ECG leads and intervals. First, the average relevance scores of each ECG lead in the confusion matrix were calculated (Table 2). Regardless of prediction results, the aVR lead had the highest relevance score, indicating it as the most referenced by the model in PAF diagnosis. In contrast, other ECG features showed low relevance scores, suggesting limited predictive effect. To identify the most significant interval for PAF diagnosis and minimize mutual cancellation of ECG signals, we constructed an averaged ECG by aligning, sorting, and interpolating each QRS complex based on the R-peaks. Figure 4 displays this summarized ECG along with LRP intensities for the true positive cases. We summarized ECGs for true positives (Fig. 4, black) and negatives (Fig. 4, blue) for each lead. These summaries reveal a significant difference in the ST segment and T wave regions. In particular, the true positives showed T wave depression, suggesting that an inverted (or flattened) T wave may influence the PAF diagnosis. The T waves, indicating ventricular repolarization [37], are commonly classified as nonspecific ST-T abnormalities (NSTTA) when flattened. To identify the most significant ECG interval in PAF diagnosis, the average LRP weights across intervals were compared (Table 3). The ST segment and QRS complex emerged as the strongest predictors for PAF. We concluded that NSTTA could be a characteristic associated with PAF. Studies show that ST segment depression and T wave inversion are significant markers for cardiovascular disease, with T wave inversion linked to increased mortality risk [38,39]. Additionally, transient ST segment depression has been observed during PAF episodes and linked to underlying coronary artery disease [40]. These findings indicate the association between NSTTA and PAF, which is consistent with our results, underscoring the significance of NSTTA and inverted T waves in predicting early PAF diagnosis, further emphasizing their clinical relevance in arrhythmia detection. However, the relationship between NSTTA and PAF has received limited attention, and our analysis confirms that a flattened T wave influences PAF diagnosis. This suggests that T waves could serve as novel predictors for early PAF detection and that deep learning models can effectively reveal complex mechanisms in PAF diagnosis.
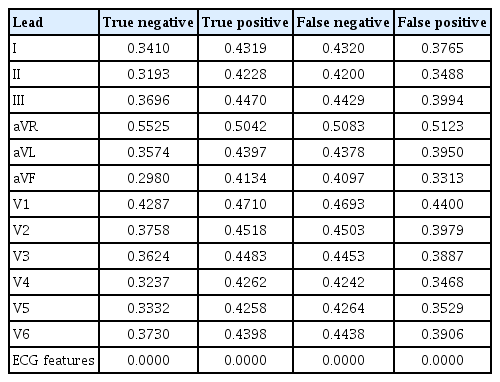
Average of relevance scores for each ECG lead in the confusion matrix

Identification of major contributors to PAF diagnosis through model explainability with the LRP method. Overlay of summarized ECG signals for all true positive (black) and negative (blue) cases. The ECG signals for each lead are aligned and interpolated into one signal. The LRP projection map for true positives is highlighted in red, with the darker red regions indicating a stronger contribution to PAF diagnosis. LRP, layer-wise relevance propagation; ECG, electrocardiogram; PAF, paroxysmal atrial fibrillation.
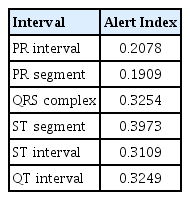
Relevance scores for each ECG interval
DISCUSSION
In this study, we demonstrate the development and analysis of an explainable deep learning algorithm applied to ECG data for early PAF detection. The model showed strong classification performance, even with relatively few positive cases, reflecting the prevalence of PAF in the general population. Across 30 different, nonoverlapping datasets, the model consistently performed well, with an AUC of 0.905 ± 0.007. These findings suggest the potential for clinical tests to prescreen patients at risk of onset PAF during NSR.
The explainability of deep learning closely relates to the reliability of the model output. Identifying potential patterns of AF is crucial, as many PAF cases are asymptomatic. We aim to uncover patterns of AF onset in ECGs primarily classified as NSR. Direct analysis is challenging due to the variability in individual ECG characteristics. Using the classification results of the AI model, the outputs were summarized based on the QRS complex, key contributors to model inference were identified for each major interval, and the ECGs were compared between the control and PAF groups. Our deep learning inference analysis revealed that the model referenced the aVR lead most frequently in PAF diagnosis, with the ST segment exerting the greatest influence among ECG intervals. Additionally, ECG features such as age, sex, and PR interval contributed minimally, suggesting that ECG signals may interact nonlinearly in some cases of early PAF detection, which traditional methods cannot fully explain. These findings suggest that the proposed model predicts potential ventricular dysfunction, indicating structural changes that preidentify the disease before AF onset. We identified a previously undescribed and significant role of NSTTA in PAF diagnosis. However, further research into the role of NSTTA and T wave variations is essential to understand their clinical significance in diagnosing PAF. Additional studies are needed to examine how these ECG features might enhance diagnostic accuracy and improve AI model performance in predicting PAF.
Screening strategies under atypical conditions, such as PAF, face inherent limitations owing to false-positive or low-positive cases. To address this, we trained the model with higher weighting on positive cases. Consequently, the model demonstrated high negative predictive value, supporting the feasibility of a low-cost screening test. We believe the described methods may benefit numerous clinical situations. For instance, the output of the model could serve as an alert index. Primary cardiologists can leverage early detection tools to proactively assess the safety of surgical procedures or pacing modalities. This study has some limitations, including its single-center design, which requires validation across diverse healthcare systems. Data imbalance may influence specificity and AUROC, and the absence of personalized information extraction hinders individualized analysis. Additionally, ECG summarization based on true positive and negative cases may reduce detail on specific ECG intervals. In conclusion, an AI model based on standard 12-lead ECG data can predict future AF onset in NSR, with model inference rationale analyzed. Through external validation in more varied cohorts, our model can enhance PAF screening strategies and serve as a proactive clinical tool.
KEY MESSAGE
1. Developed a deep learning model to diagnose AF onset in potential patients exhibiting NSR.
2. Employed a deep learning explanation method to verify the decision basis of the model and investigated ECG patterns influencing the results.
3. Indicating a potential association between NSTTA and PAF, highlighting the need for future validation across various systems.
Notes
Acknowledgments
Special thanks to Dr. Seong Won Jeon, Dr. Changhyun Kim, and Dr. Dong Kyun Kim for the diagnosis and labeling of ECGs.
CRedit authorship contributions
Yeongbong Jin: conceptualization, investigation, writing - original draft, visualization; Bonggyun Ko: conceptualization, investigation, formal analysis, writing - original draft, supervision; Woojin Chang: formal analysis, supervision; Kang-Ho Choi: investigation, formal analysis, validation; Ki Hong Lee: investigation, writing - review & editing, supervision
Conflicts of interest
The authors disclose no conflicts.
Funding
This work was supported by the National Research Foundation of Korea (NRF) grant funded by the Korea government (MSIT) (No. 2019R1G1A1100704, No. 2021R1F1A1060049 and No. 2022M3A 9E4017151), a grant (BCRI23054) of Chonnam National University Hospital Biomedical Research Institute, a grant of Establishment of K-Health National Medical Care Service and Industrial Ecosystem funded by the Ministry of Science and ICT (MSIT, Korea)(No. ITAH0603230110010001000100100) and also by the BK21 FOUR (Fostering Outstanding Universities for Research, NO.5120200913674) funded by the Ministry of Education (MOE, Korea) and National Research Foundation of Korea (NRF).