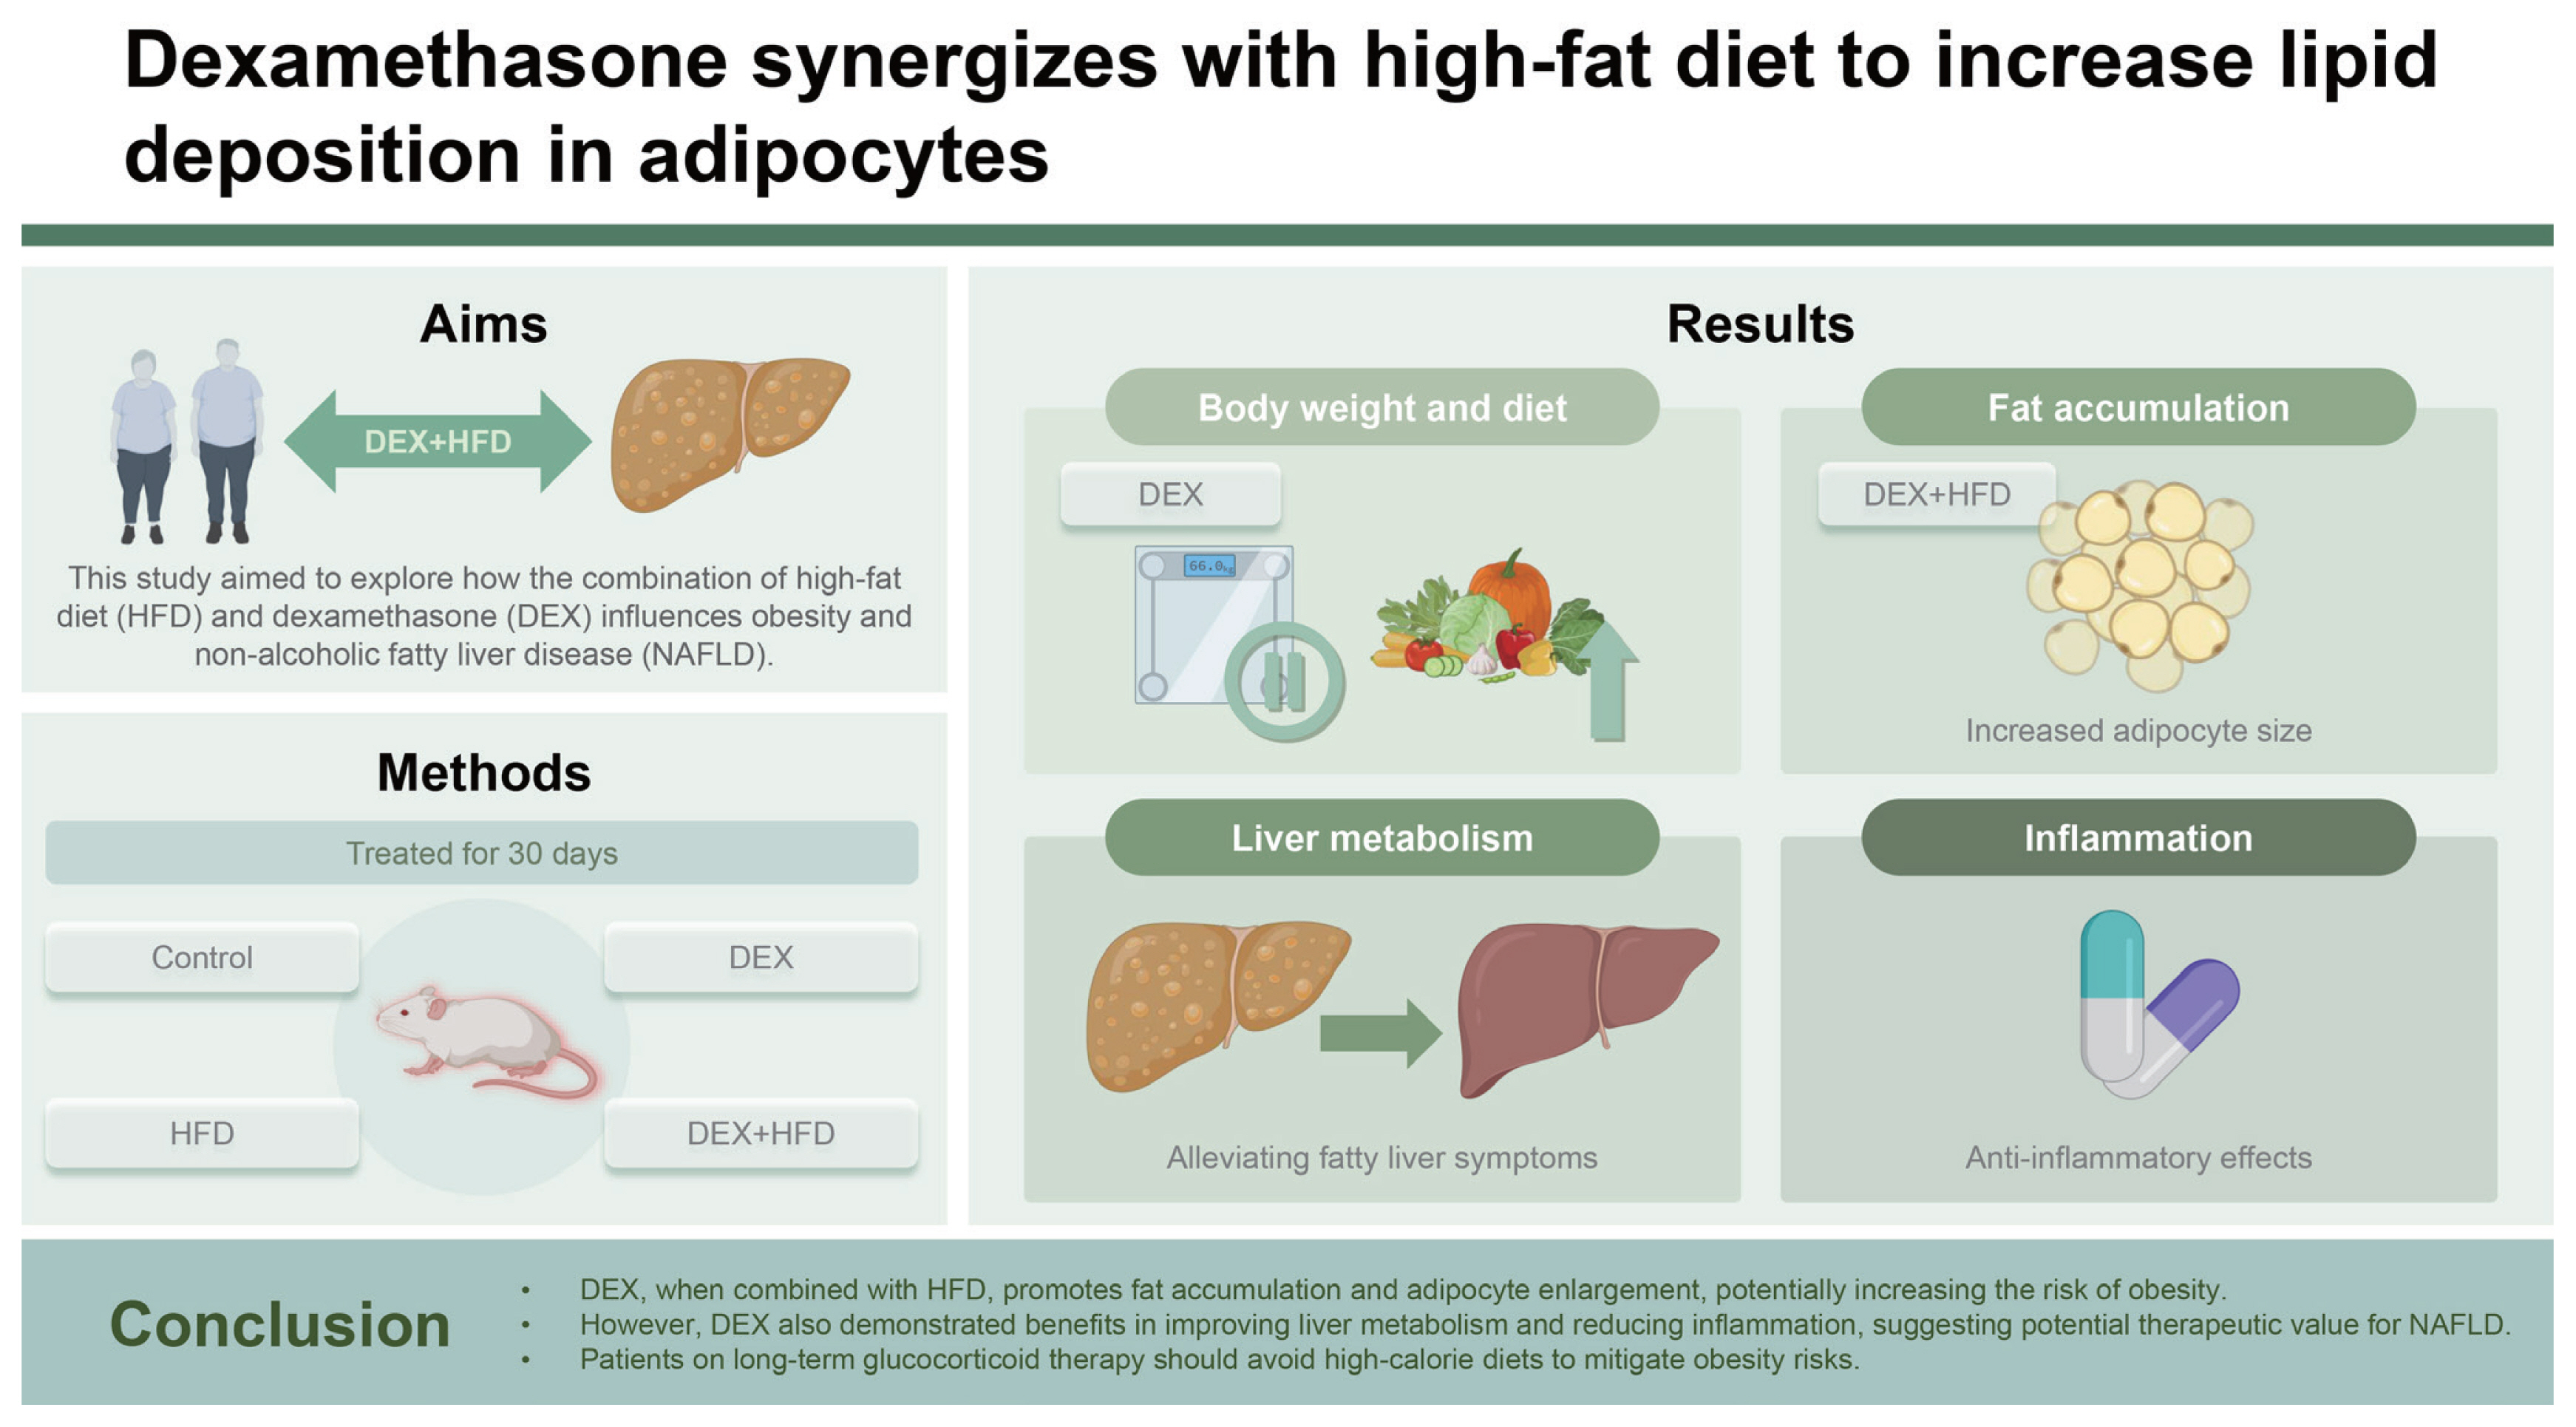
Dexamethasone synergizes with high-fat diet to increase lipid deposition in adipocytes
Article information
Abstract
Background/Aims
Dexamethasone (DEX) is a widely used exogenous therapeutic glucocorticoid in clinical settings. Its long-term use leads to many side effects. However, its effect on metabolic disorders in individuals on a high-fat diet (HFD) remains poorly understood.
Methods
In this study, HFD-fed mice were intraperitoneally injected with DEX 2.5 mg/kg/day for 30 days. Lipid metabolism, adipocyte proliferation, and inflammation were assayed using typical approaches.
Results
DEX increased the epididymal fat index and epididymal adipocyte size in HFD-fed mice. The number of epididymal adipocytes with diameters > 70 μm accounted for 0.5% of the cells in the control group, 30% of the cells in the DEX group, 19% of the cells in the HFD group, and 38% of all the cells in the D+H group. Adipocyte proliferation in the D+H group was inhibited by DEX treatment. Adipocyte enlargement in the D+H group was associated with increased the lipid accumulation but not the adipocyte proliferation. In contrast, the liver triglyceride and total cholesterol levels and their metabolism were downregulated by the same treatment, indicating the therapeutic potential of DEX for nonalcoholic fatty liver disease.
Conclusions
DEX synergizes with HFD to promote lipid deposition in adipose tissues. A high risk of obesity development in patients receiving HFD and DEX treatment is suggested.
INTRODUCTION
Obesity is defined as an excessive increase and abnormal accumulation of fat in adipose tissues, putting people’s health at high risk [1]. The prevalence of obesity continues to increase globally and has become a public health concern [2]. Obesity is associated with dietary, genetic, environmental, physiological, and social factors. Some of these factors interact to promote the progress of obesity. The most recognized etiology of obesity is excessive dietary intake [3]. A high-fat diet (HFD) is characterized by a high calorie/fat content consumed by many households. This lifestyle increases the daily caloric intake, leading to obesity [4]. However, it is not fully studied how obesity induced by HFD is affected by concurrent medications.
Dexamethasone (DEX) is a glucocorticoid (GC) widely used to treat inflammation, allergy, arthritis, oncological, and infectious diseases [5]. The long-term use of high-dose GCs often causes severe side effects [6–8]. Clinical symptoms develop due to endogenous GC overload in diseases such as Cushing’s syndrome [9]. In the clinic, low-dose GC treatment is usually prescribed for hormone replacement therapy in patients with hypopituitarism and for anti-immune therapy in patients with systemic lupus erythematosus [10,11]. GC treatment at therapeutic doses increases the total amount of adipose tissue [12,13]. However, the obesogenic effect of the HFD and GC combination is poorly understood.
Nonalcoholic fatty liver disease (NAFLD) is a diffuse steatosis of the liver parenchymal cells caused by multiple etiologies other than alcohol. It is a pathological syndrome characterized by triglyceride (TG) accumulation [14]. With the global increase in metabolic syndrome, the prevalence of NAFLD has increased significantly, affecting approximately 25% of the global population [15]. The liver is the primary organ for TG metabolism and is involved in the digestion, absorption, synthesis, catabolism, and transport of TG [16]. In Wistar rats, oral administration of DEX at 0.05 and 0.5 mg/kg for 6–7 weeks reduced the amount of lipid in the liver [17,18]. Intraperitoneal injection of DEX at 1–5 mg/kg/day (d) was reported to cause lipid accumulation in the liver in mouse models, most of which were fed a chow diet [13,19,20]. Moreover, high doses (15 and 50 mg/kg/d) of intraperitoneal DEX similarly induced lipid accumulation in the liver of mice [21,22]. Accordingly, the reported effects of DEX on lipid metabolism are inconsistent. However, the therapeutic potential of DEX for NAFLD treatment has not yet been suggested.
In this study, HFD mice were treated with DEX 2.5 mg/kg/d for 30 days. Lipid storage, lipid metabolism, and adipocyte proliferation in epididymal adipose tissues and liver tissues were measured to evaluate the combined effects of DEX and HFD on obesity and NAFLD development.
METHODS
Materials and reagents
Assay kits for determining TG and total cholesterol (TC) levels were acquired from Meikang Biotechnology Co., Ltd. (Ningbo, China). The BCA Kit and 5× sodium dodecyl sulfate-polyacrylamide gel electrophoresis (SDS-PAGE) loading buffer for protein quantification were obtained from Beyotime Biotechnology Co., Ltd. (Shanghai, China). Super sensitive ECL luminescent liquid was bought from Shanghai Qichun Biotechnology Co., Ltd. (Shanghai, China). DEX was provided by Aladdin Biochemical Technology (Shanghai, China). Rabbit antibody against GAPDH (1:10,000, ab181602) was acquired from Abcam Corporation (Boston, MA, USA). Mouse antibody against PCNA (1:10,000, 60097-1-lg) was a product by Proteintech (Wuhan, China). Rabbit antibodies against YAP (1:10,000, A21216) and phospho-YAP (1:1,000, AP0489) were supplied by ABClonal (Wuhan, China). The second antibodies against rabbit (1:5,000, SA00001-2) and mouse (1:5,000, SA00001-1) were bought from Proteintech. The reverse transcription kit for the quantitative polymerase chain reaction and 2× PerfectStart-Green qPCR SuperMix were obtained from Beijing Quanshi Gold Biotechnology Co., Ltd. (Beijing, China). Ready-for-use hematoxylin and eosin (H&E) working solutions were purchased from Solarbio (Beijing, China).
Animal and treatment
Male 129/Sv mice (8–10 weeks, 20 ± 2 g) were previously described [23,24]. All mice were housed in the Experimental Animal Center of Ningbo University for at least one week before the experiment. The room temperature was 23 ± 1°C, with a humidity of 60–70% and a light-dark cycle of 12 h/12 h. All animal procedures and protocols were approved by the Animal Care and Use Committee of Ningbo University (approval no. NBU20210149).
Mice were randomly divided into four groups: control (Con), DEX, HFD, and DEX + HFD (D+H) (n = 5). The mice in the DEX group were intraperitoneally injected with DEX 2.5 mg/kg once daily at 09:00 AM. HFD group was fed HFD. The D+H mice were treated with DEX and HFD simultaneously. The Con group was fed a normal diet (ND) and was intraperitoneally injected with saline only. The experiment lasted 30 days, during which the food intake was measured every two days, and the body weight (BW) was recorded.
When the experiment ended, the mice were sacrificed at 09:00 AM. The blood was collected by retro-orbital bleeding. Half of the largest liver lobe and one side of epididymal adipose tissue were obtained and fixed in 10% formalin solution for histopathological analysis. All the remaining tissues were stored at −80°C for biochemical analysis.
Biochemical analysis
The plasma TG and TC levels were measured following the manufacturer’s instructions. Liver/epididymal adipose tissue (20 ± 2 mg) was added to 180 μL saline and homogenized. Then, liver TG and TC and adipose TG and TC levels were measured using the same method for plasma lipid determination.
Western blot assay
About 80 mg epididymal adipose tissues were homogenized in 250 μL radio immunoprecipitation assay containing 1% phenylmethanesulfonyl fluoride and 1% phosphoryl protease inhibitor. The protein concentration was quantified using a BCA protein assay kit. Then, 5× SDS-PAGE loading buffer was mixed with the samples, which were boiled for 8 minutes. The samples were separated into 10% SDS-polyacrylamide gels. The blots were transferred to the polyvinylidene fluoride (PVDF) membranes and blocked with 5% milk for 3.5 hours at room temperature. PVDF membranes were incubated overnight with primary antibodies against PCNA, YAP, phospho-YAP, and GAPDH. The secondary antibody was incubated at room temperature for 2 hours. The hypersensitive ECL luminescent solution was then added to the PVDF membranes, and images were captured using a Tanon 4200SF (Tanon, Shanghai, China).
Quantitative-PCR analysis
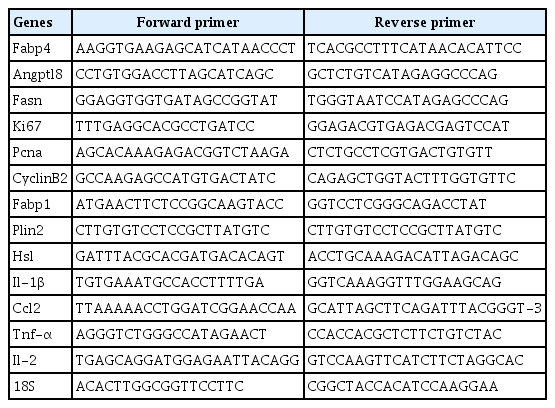
Primer sequences used in this study were listed in Table 1. Total RNA extracted from epididymal adipose tissue (80 mg) and liver tissues (20 mg) homogenized in TRIzol reagent was measured. The reverse transcription system (15 μL) was prepared separately, which included gDNA Remover 0.75 μL, 5× TransScript-Uni ALL-in-One SuperMix for qPCR 3 μL, total RNA + RNase-free water 11.25 μL. Primer specificity was confirmed using the dissolution curve. PCR amplification system (5 μL) included cDNA 1 μL, forward primer 0.1 μL, reverse primer 0.1 μL, 2× PerfectStart-Green qPCR SuperMix 2.2 μL, and nuclease-free water 1.6 μL. Quantitative PCR amplification was performed using a LightCycler 480II (Roche, Nutley, NJ, USA) in a 96-well plate. The internal parameter used was 18S RNA. The mean cycle threshold (CT) value for each gene in the Con group was set to 1, and the average CT values of the other genes were normalized and expressed as relative abundance.
Histopathological assessment
The fixed liver tissues were dehydrated in alcohol and xylene. The specimens were then embedded in paraffin. The paraffin block was cut into 4 μm slices and stained with HE. Finally, sections were mounted in neutral gum and observed under an Olympus BX51 light microscope. H&E staining of mouse epididymal adipose tissue was performed using the same method. The maximum diameters of adipocytes in three viewing areas of epididymal adipose tissue from each mouse were measured using ImageJ (National Institutes of Health, Bethesda, MD, USA; 1.53e). Histograms were plotted based on the distribution of epididymal adipocyte diameter.
Statistical analysis
The data were presented as mean ± standard deviation. Statistical analysis was performed using the software GraphPad Prism (version 8.0.2). Student’s t-test was used to compare differences between the two groups. Differences between more than two groups were compared using a one-way analysis of variance (ANOVA) followed by Tukey’s post-hoc comparisons. p < 0.05 was considered statistically significant.
RESULTS
DEX increased the diet intake of HFD mice
During the 30-day DEX treatment, BW in the DEX groups was lowered by 7.3% (DEX vs. Con). BW in the D+H group decreased by 7.7% compared with the HFD group (D+H vs. HFD) (Fig. 1A). Food intake was significantly lower in the HFD group than that in the Con group. This was significantly elevated by DEX treatment under ND and HFD (Fig. 1B). Plasma TC level was elevated by 64% in the DEX group in comparison with that of the Con group. Compared with the HFD group, plasma TC level was elevated by 32% in the D+H group. Plasma TC level was elevated by 59% in the D+H group compared to the DEX group (Fig. 1C). However, plasma TG level was decreased by 25% in the D+H group compared with the HFD group (Fig. 1D). Compared with the HFD group, plasma glucose levels were elevated by 36% in the D+H group (Supplementary Fig. 1A). There was no difference in the plasma insulin levels between the groups (Supplementary Fig. 1B). These data exhibited that DEX treatment reduced BW gain in mice. However, food intake was increased in mice after DEX treatment under ND and HFD. Regarding lipid levels, plasma TC, not TG, was increased by DEX treatment.
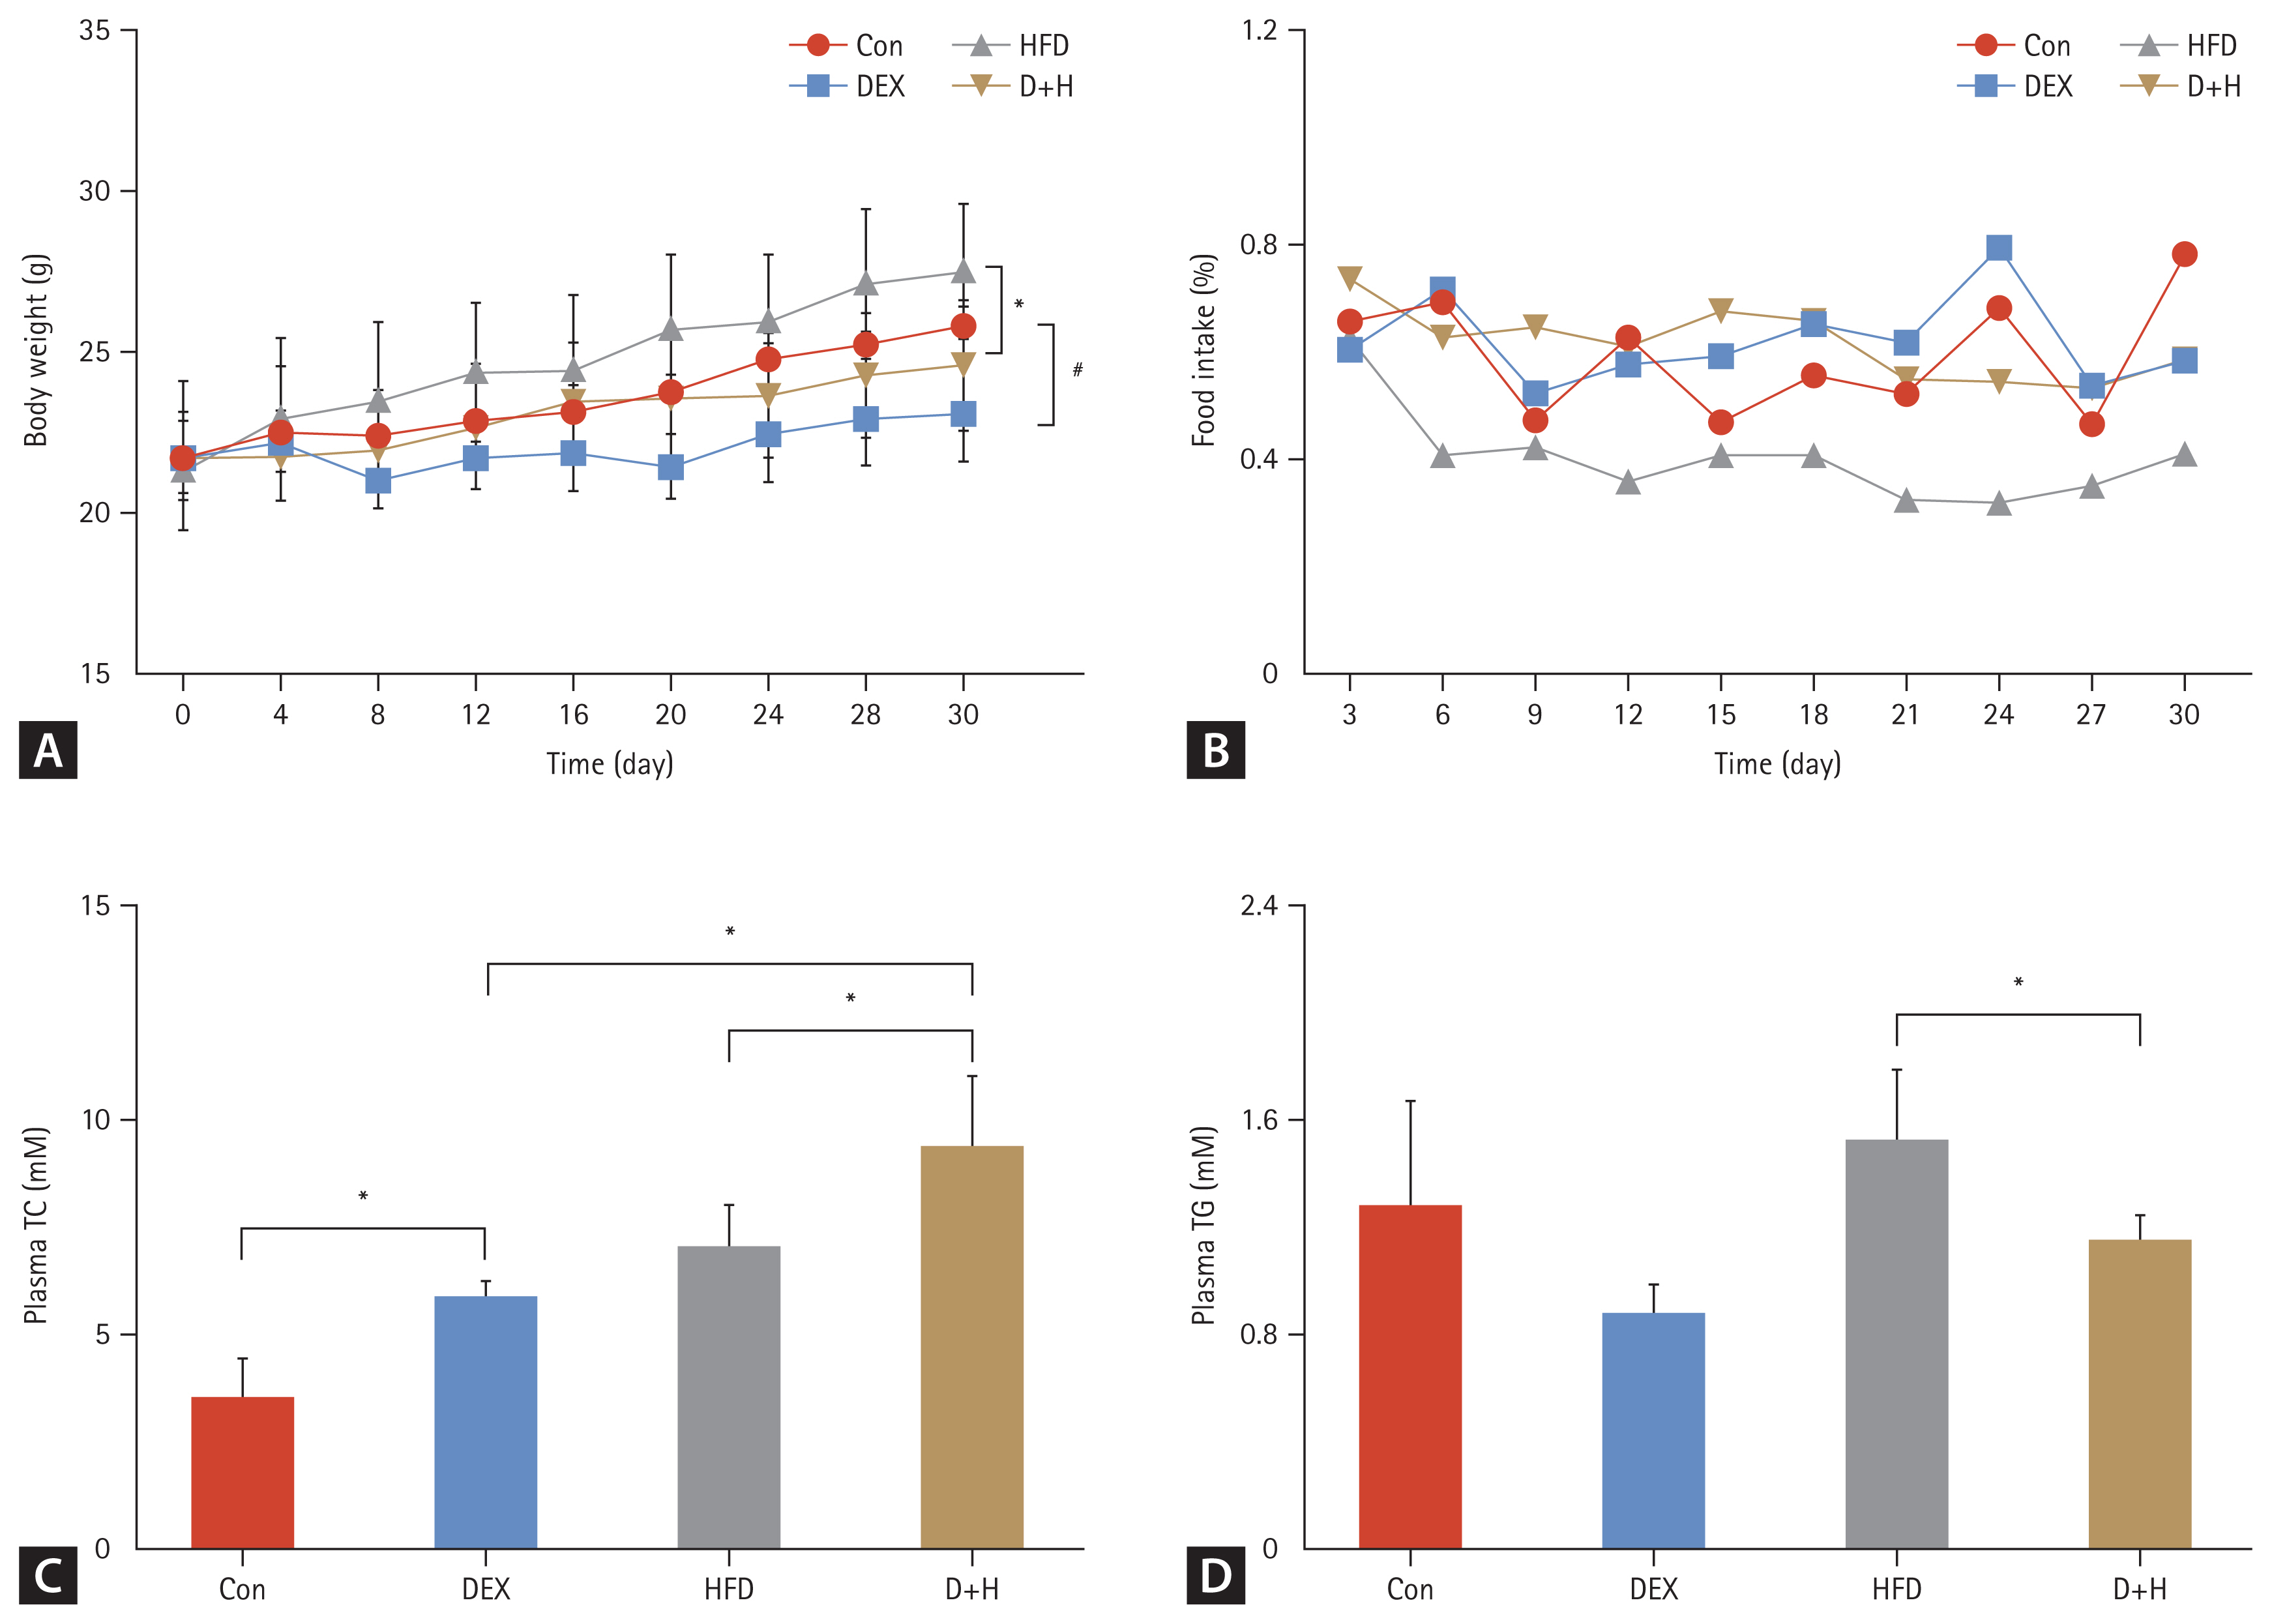
Body weight, food intake, and blood lipid levels during the 30-day DEX treatment. (A) Body weight changes in different groups. (B) Food intake trends in different groups. (C, D) Plasma TC and TG levels in each group. The Con group was intraperitoneally injected with saline only. The mice in the DEX group were intraperitoneally injected with DEX 2.5 mg/kg once daily at 09:00 AM. HFD mice were fed HFD. D+H mice were intraperitoneally injected with DEX 2.5 mg/kg once daily at 09:00 AM and fed HFD. Data are expressed as mean ± standard deviation. HFD, high-fat diet; DEX, dexamethasone; D+H, DEX + HFD; TC, total cholesterol; TG, triglyceride. *Indicated p < 0.05, in comparison between DEX and Con groups. #Indicated p < 0.05, in comparison between D+H and HFD groups.
Adipocyte enlargement was caused by DEX and HFD combination
Adipose tissue weight was elevated by 70% in the D+H group compared with the DEX group (Fig. 2A). Compared with the DEX group, the adipose weight (AW)/BW was elevated by 66% in the D+H group. Moreover, AW/BW was elevated by 44% in HFD-fed mice under DEX treatment (D+H vs. HFD) (Fig. 2B). The adipose TG level was increased by 89% in the DEX group compared with that in the Con group. DEX treatment increased TG level by 81% in the adipose tissues of HFD-fed mice (D+H vs. HFD) (Fig. 2C). There was no difference in TC level among the groups (Fig. 2D). These results indicated that DEX treatment induced an increase in AW/BW and adipose TG in HFD-fed mice.
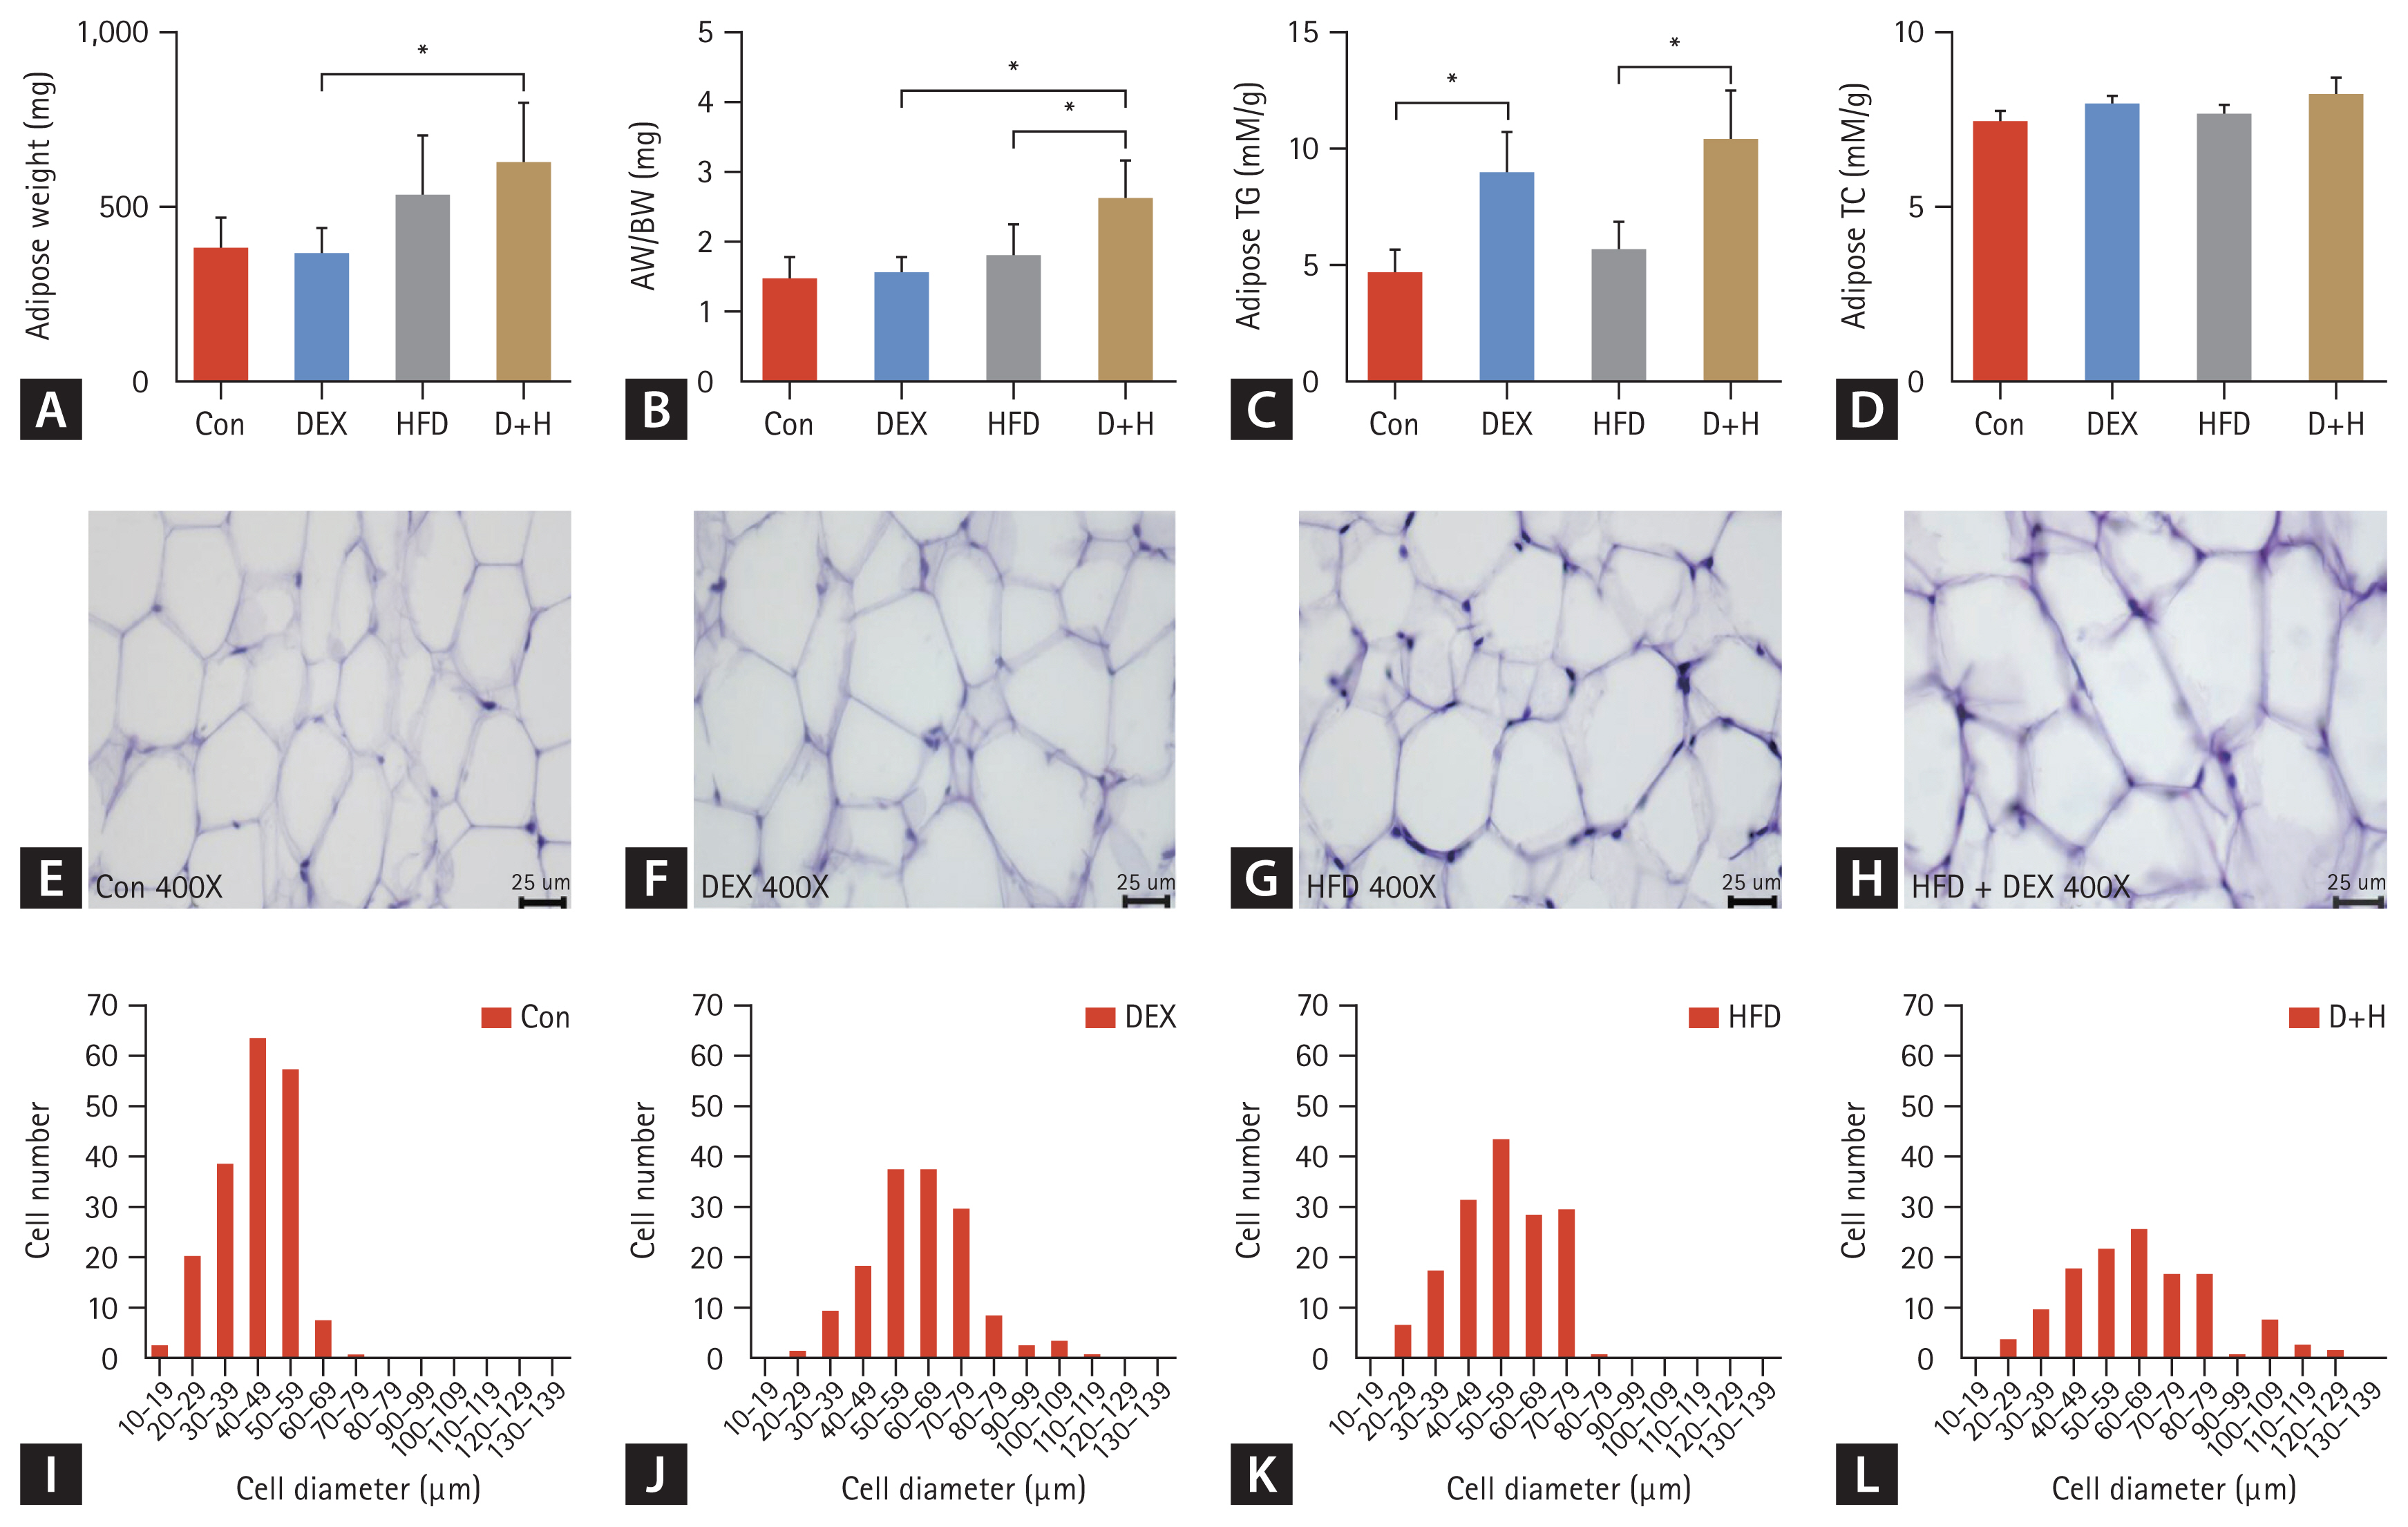
Effect of DEX treatment on epididymal AW, epididymal fat index, epididymal fat lipid levels, and epididymal adipocyte size in mice. (A) AW changes in each group. (B) AW/BW changes in each group. (C, D) Adipose TG and TC levels in mice. (E–H) H&E staining of mouse epididymal adipose tissues (400×), scale bar = 25 μm. Histogram of adipocyte distribution of different diameters in epididymal adipose tissues of the (I) Con group, (J) DEX group, (K) HFD group, and (L) D+H group. The Con group was intraperitoneally injected with saline only. The mice in the DEX group were intraperitoneally injected with DEX 2.5 mg/kg once daily at 09:00 AM. HFD mice were fed HFD. D+H mice were intraperitoneally injected with DEX 2.5 mg/kg once daily at 09:00 AM and fed HFD. Data are expressed as mean ± standard deviation. DEX, dexamethasone; HFD, high-fat diet; D+H, DEX + HFD; AW, adipose weight; BW, body weight; TG, triglyceride; TC, total cholesterol. *Indicated p < 0.05, difference among groups.
To assay the effect of DEX treatment on epididymal adipocyte size in the mice, H&E staining of adipose tissues of mice epididymis was evaluated. The maximum adipocyte diameter in the Con group was mainly distributed between 40–49 μm. The number of epididymal adipocytes with diameters > 70 μm accounted for 0.5% of the cells in the group (Fig. 2I). In the DEX group, adipocyte diameters ranging from 50 to 69 μm were the most abundant. The number of epididymal adipocytes with diameters > 70 μm accounted for 30% of all cells in the group (Fig. 2J). In the HFD group, the adipocytes with diameters between 50 and 59 μm were the most abundant. The number of epididymal adipocytes with diameters > 70 μm accounted for 19% of all cells in the group (Fig. 2K). Furthermore, in the D+H group, adipocyte diameters were mainly distributed between 60 and 69 μm. The number of epididymal adipocytes with diameters above 70 μm accounted for 38% of all cells in the group (Fig. 2L). In mice on ND, DEX treatment caused enlargement of the adipocytes. Compared with the ND, HFD also increased the distribution of maximum diameter. Thus, DEX treatment and HFD synergistically caused adipocyte enlargement.
Lipid deposition, not proliferation, led to the weight gain of adipose tissue
In the evaluation of lipid metabolism, Fabp4 mRNA was increased by 1.6-fold in the DEX group compared to that in the Con group. It was increased by 70% in the D+H group compared with that of the HFD group (Fig. 3A). Angptl8 mRNA expression decreased by 68% in the D+H group compared to that in the HFD group (Fig. 3B). Fasn mRNA increased by 97.2% in the DEX group compared to that in the Con group. In contrast, it was decreased by 66% in the D+H group compared to the DEX group (Fig. 3C). These data suggested that DEX treatment promoted lipid anabolism and inhibited lipid catabolism in epididymal adipose tissues, which was more pronounced under HFD treatment.
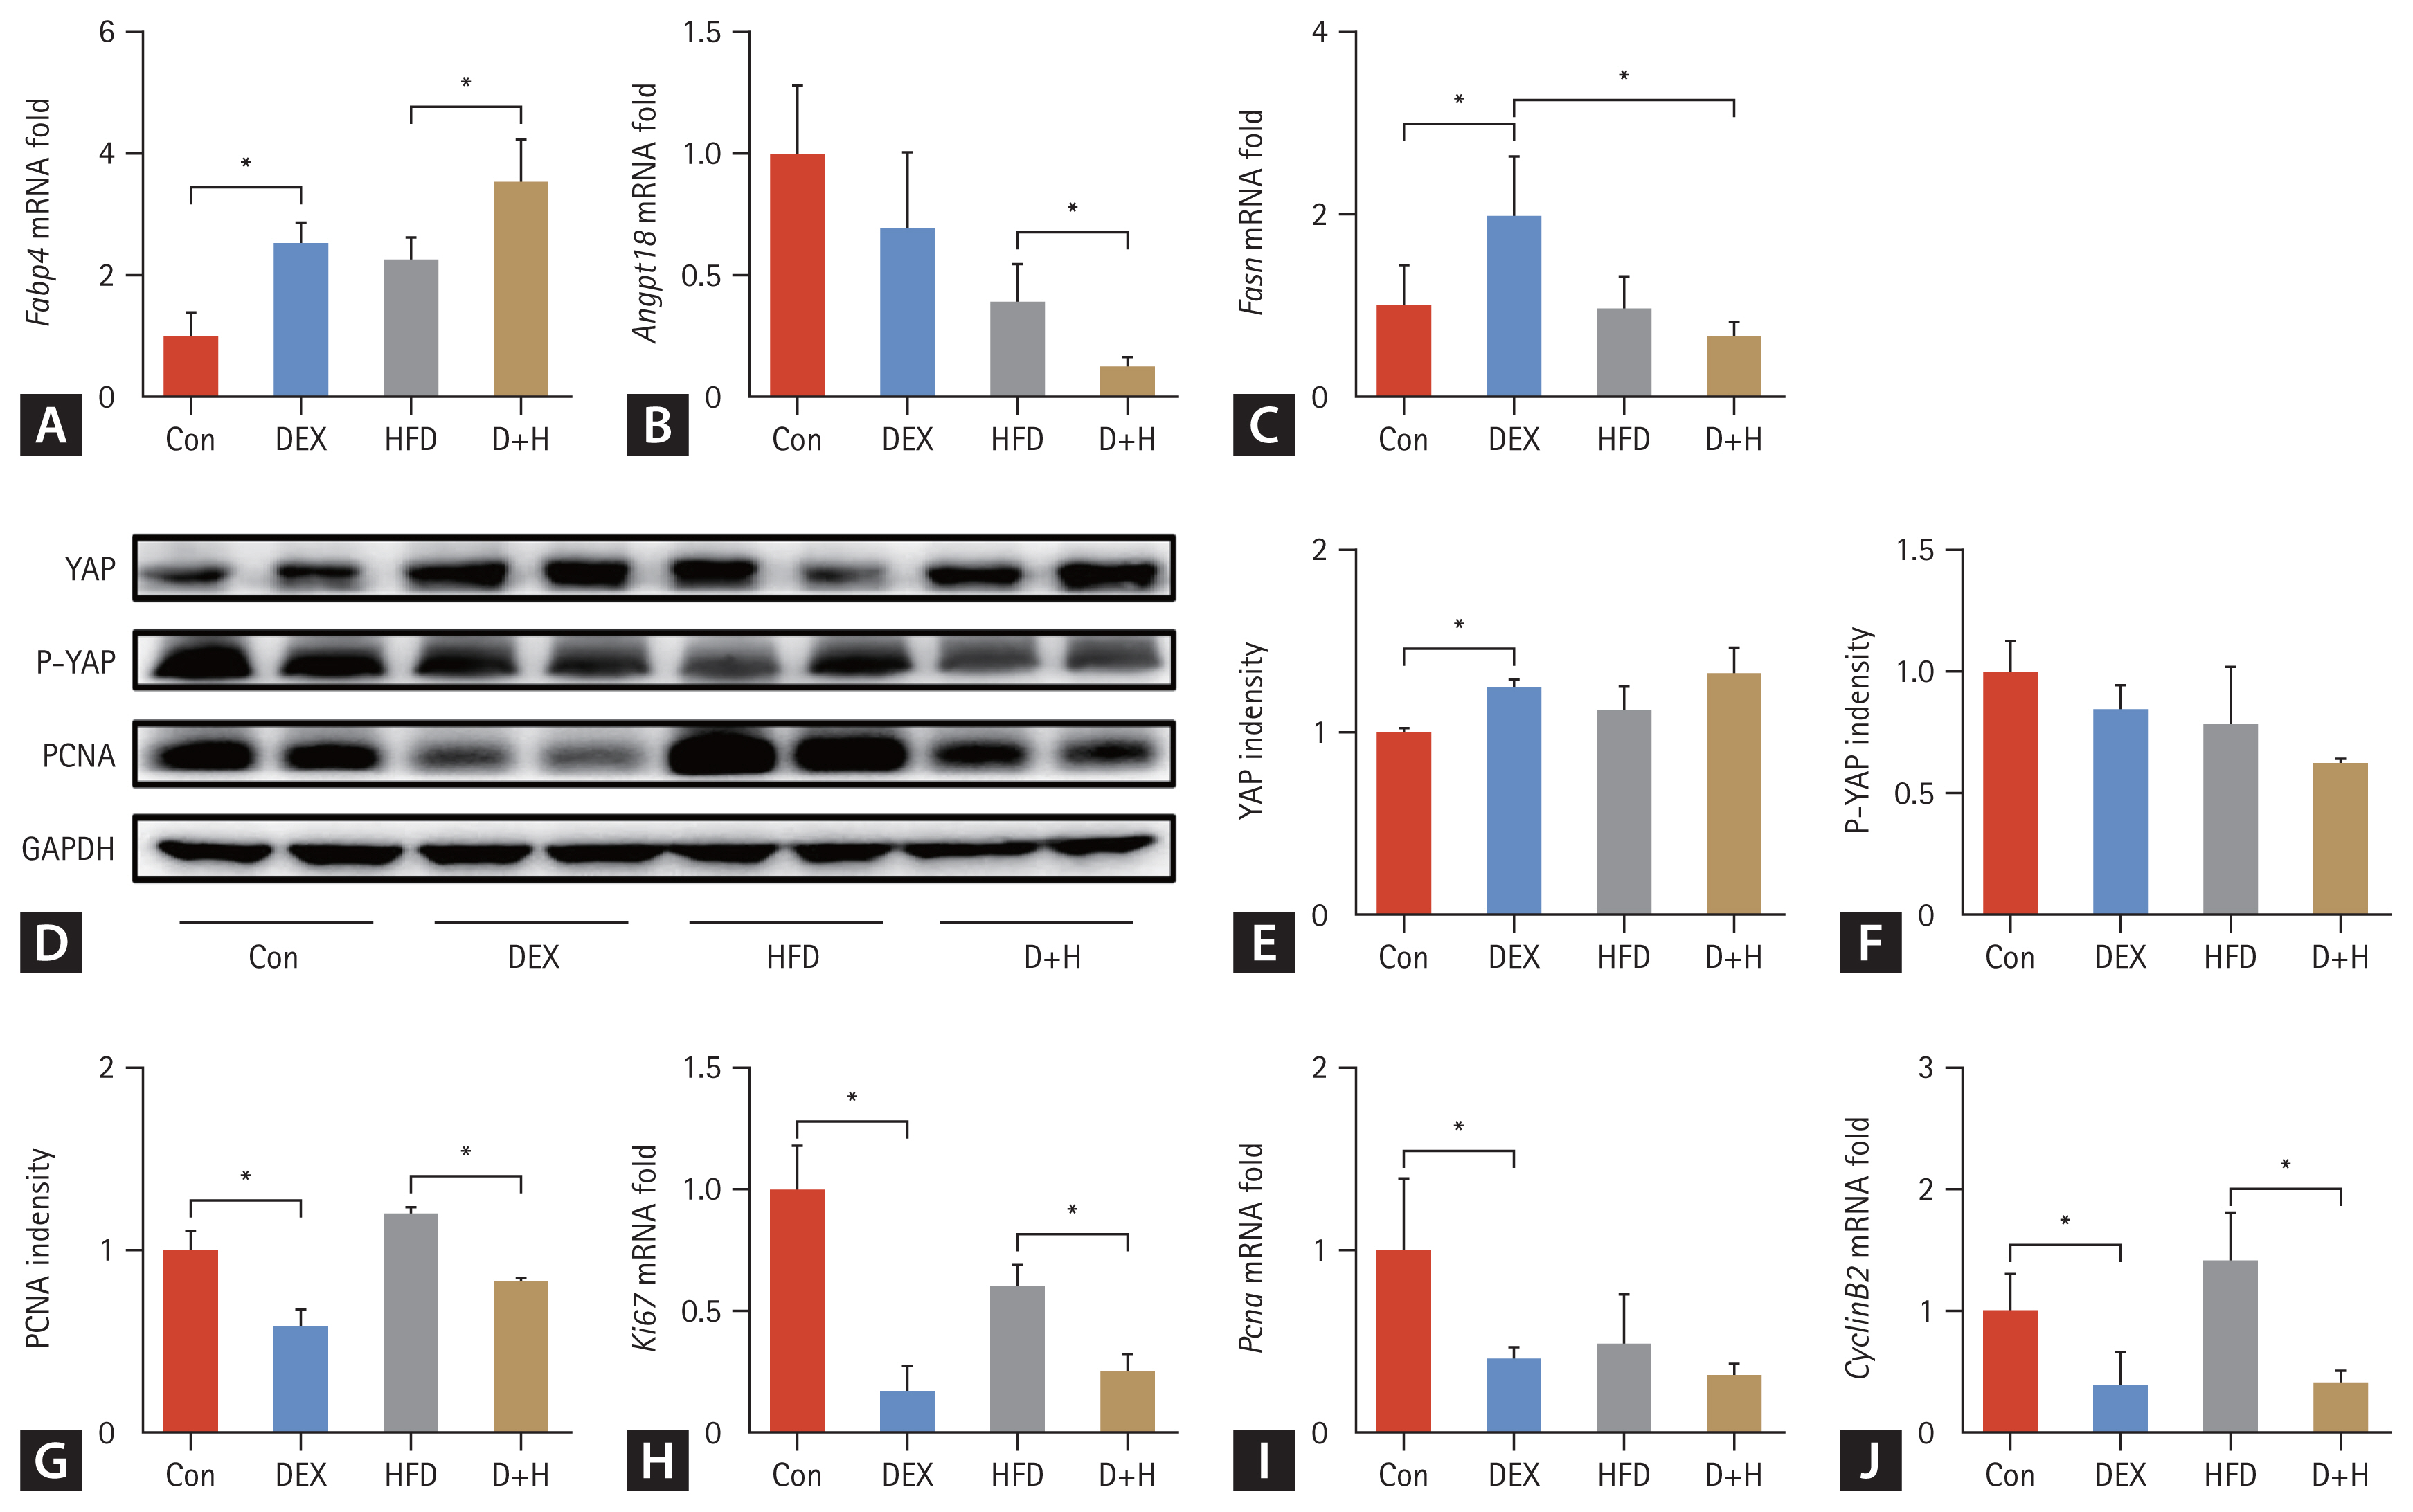
Effect of DEX treatment on lipid metabolism, the expression of proliferation-related proteins and genes in epididymal adipose tissues of mice. (A–C) Relative mRNA levels of Fabp4, Angptl8, and Fasn. (D–G) Protein expression and densitometric analysis of PCNA, YAP, P-YAP, and GAPDH in each group. (H–J) mRNA expression of Ki67, Pcna and Cyclin B2 in different groups. The Con group was intraperitoneally injected with saline only. The mice in the DEX group were intraperitoneally injected with DEX 2.5 mg/kg once daily at 09:00 AM. HFD mice were fed HFD. D+H mice were intraperitoneally injected with DEX 2.5 mg/kg once daily at 09:00 AM and fed HFD. Data are expressed as mean ± standard deviation. DEX, dexamethasone; HFD, high-fat diet; D+H, DEX + HFD. *Indicated p < 0.05, difference among groups.
To clarify whether DEX treatment triggered epididymal adipocyte proliferation, proliferation-associated protein levels, and gene transcription in epididymal adipose tissues were measured. YAP was upregulated by 25% in the DEX group compared to the Con group (Fig. 3D, E). There was no difference in P-YAP level among the groups (Fig. 3D, F). Compared with the Con group, PCNA expression was downregulated by 41% in the DEX group. In the D+H group, it was downregulated by 31% compared with the HFD group (Fig. 3D, G). Similarly, its mRNA level was decreased by 60% in the DEX group compared to the Con group (Fig. 3I). For Ki67, its mRNA was reduced by 83% in the DEX group compared with the Con group. Compared to the HFD group, it was decreased by 59% in the D+H group (Fig. 3H). Cyclin B2 mRNA was reduced by 61% in the DEX group compared to the Con group. It was decreased by 71% in the D+H group than that in the HFD group (Fig. 3J). Taken together, DEX treatment inhibited, not promoted the epididymal adipocyte proliferation.
Steatosis in mice on HFD was alleviated by DEX
The results suggested that liver weight (LW) and LW/BW did not differ among the groups (Fig. 4A, B). In liver tissues, the TG level was increased by 4.6-fold in the HFD group compared with that in the Con group. The TG level was 1.3-fold higher in the D+H group than that in the DEX group. However, compared to the HFD group, the liver TG level was decreased by 54% in the D+H group (Fig. 4C). Likewise, the liver TC level was increased by 46% in the HFD group in comparison with that of the Con group. In contrast, it decreased by 20% in the D+H group than the HFD group (Fig. 4D). H&E staining depicted that the liver lobules were structurally normal in the Con and DEX groups. Fatty vacuoles in liver tissues were larger and more abundant in the HFD group than in the D+H group (Fig. 4E–H). These results indicated that DEX treatment and HFD feeding did not affect the LW or LW/BW ratio. Liver TC and TG levels were elevated after HFD feeding. Nevertheless, liver TG and TC levels decreased after DEX treatment in HFD-fed mice.
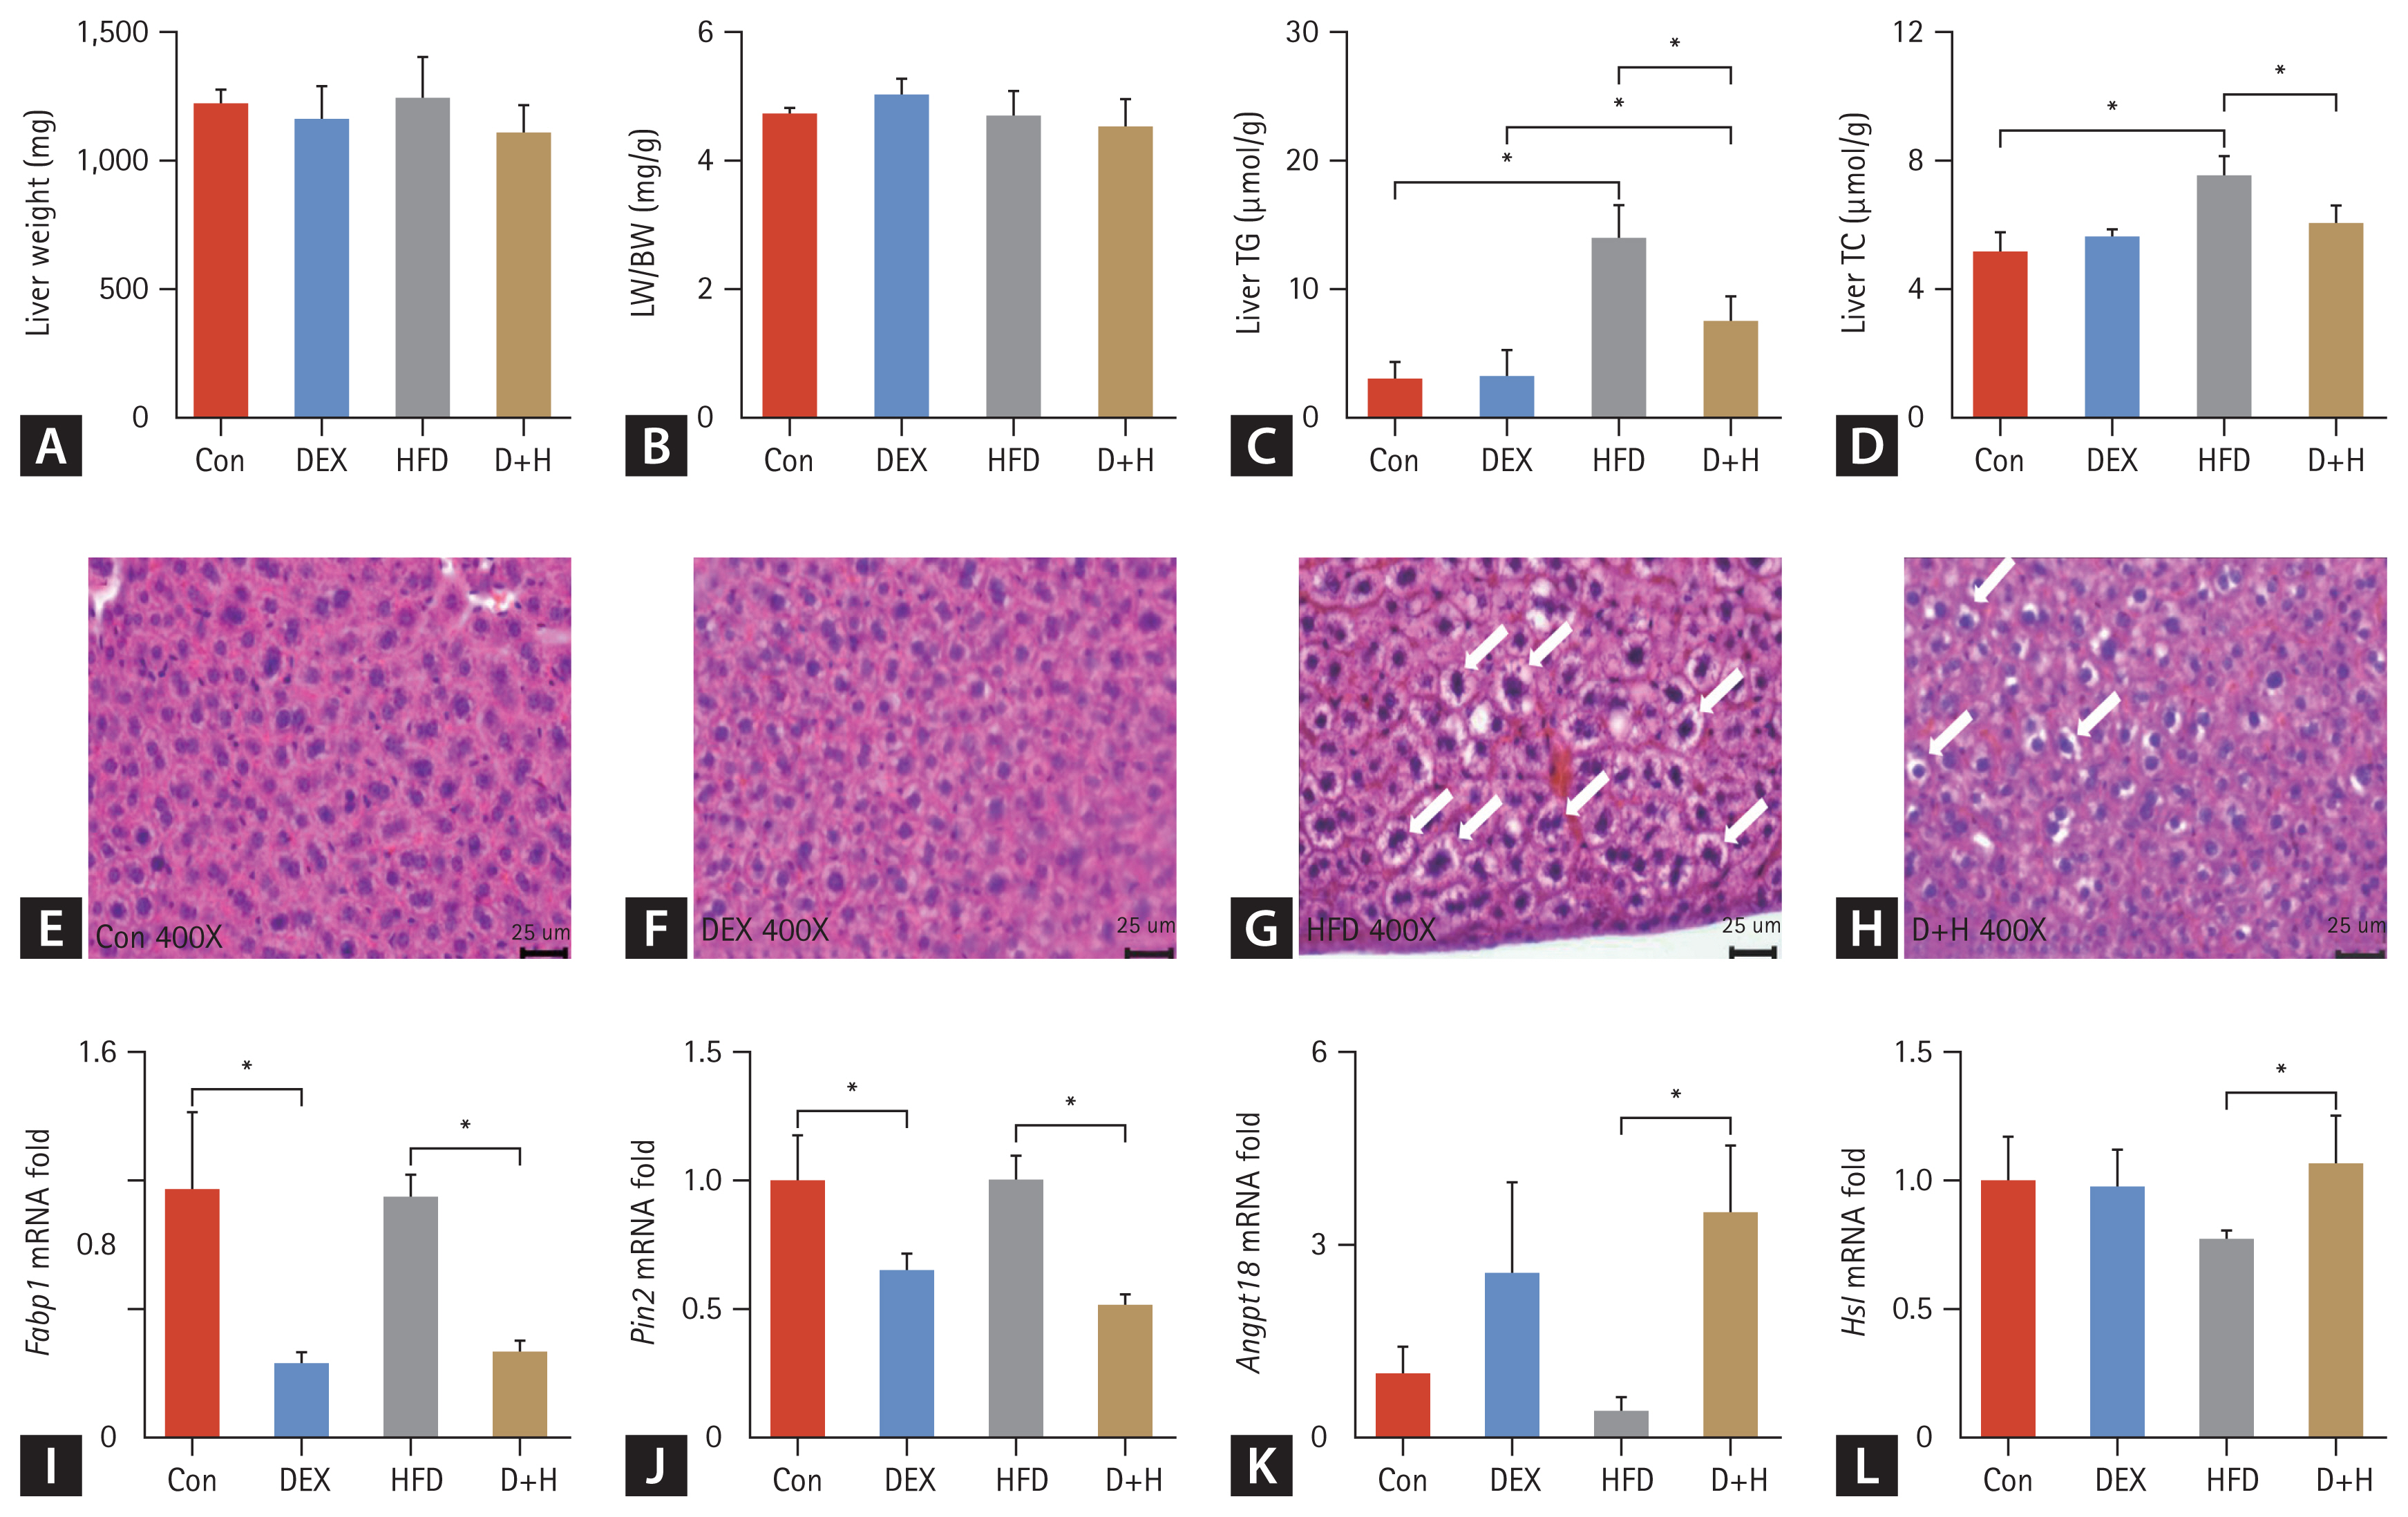
Effects of DEX treatment on lipid content and, lipid metabolism in liver tissues. (A) LW changes in different groups. (B) LW/BW ratio changes in each group. (C, D) Liver TG and TC levels in each group. (E–H) H&E staining of mouse epididymal adipose tissues (400×), scale bar = 25 μm. Fatty vacuoles in liver tissue are represented by white arrows. (I–L) mRNA expression of lipid metabolism (Fabp1, Plin2, Angptl8, and Hsl) in different groups. The Con group was intraperitoneally injected with saline only. The mice in the DEX group were intraperitoneally injected with DEX 2.5 mg/kg once daily at 09:00 AM. HFD mice were fed HFD. D+H mice were intraperitoneally injected with DEX 2.5 mg/kg once daily at 09:00 AM and fed HFD. Data are expressed as mean ± standard deivaiton. DEX, dexamethasone; HFD, high-fat diet; D+H, DEX + HFD; LW, liver weight; BW, body weight. *Indicated p < 0.05, difference among groups.
Among the hepatic lipid metabolism genes, Fabp1, Plin2, Angptl8, and Hsl mRNA were altered by DEX treatment. Fabp1 mRNA expression was decreased by 70% in the DEX group compared with the Con group. Compared to the HFD group, the Fabp1 mRNA was reduced by 65% in the D+H group (Fig. 4I). Plin2 mRNA was decreased by 35% in the DEX group compared with the Con group and decreased by 49% in the D+H group compared with the HFD group (Fig. 4J). For Angptl8, the mRNA of D+H was increased by 7-fold in comparison with that of the HFD group (Fig. 4K). Compared to the HFD group, Hsl mRNA in the D+H group was increased by 38% (Fig. 4L). The data suggested that DEX treatment inhibited hepatic fatty acid uptake and hepatic lipid storage but promoted lipid clearance and lipolysis in the mouse liver.
Regarding inflammation, the Il-1β mRNA was decreased by 60% in the DEX group than the Con group and decreased by 86% in the D+H group than the HFD group (Fig. 5A). For Ccl2, its mRNA was reduced by 81% in the D+H group compared with the HFD group (Fig. 5B). Tnf-α mRNA level was decreased by 53% in the D+H group compared to the HFD group (Fig. 5C). The Il-2 mRNA was reduced by 49% in the D+H group in comparison with that of the HFD group (Fig. 5D). These data indicated that DEX treatment inhibited hepatic inflammatory response in mouse liver.

Effects of DEX treatment on inflammation in the liver. (A–D) mRNA expression of inflammatory factors (Il-1β, Ccl2, Tnf-α, and Il-2) in each group. The Con group was intraperitoneally injected with saline only. The mice in the DEX group were intraperitoneally injected with DEX 2.5 mg/kg once daily at 09:00 AM. HFD mice were fed HFD. D+H mice were intraperitoneally injected with DEX 2.5 mg/kg once daily at 09:00 AM and fed HFD. Data are expressed as mean ± standard deviation. DEX, dexamethasone; HFD, high-fat diet; D+H, DEX + HFD. *Indicated p < 0.05, difference among groups.
DISCUSSION
GCs are widely used in clinical practice for anti-inflammatory, anti-allergic, immune suppression, and hormone replacement therapies. A clinical study found that oral administration of DEX 40 mg/d is the first-line therapy for immunosuppression in primary immune thrombocytopenia [25]. DEX 0.4 mg/d is suggested as a replacement therapy for congenital adrenal hyperplasia [26]. In a mouse model, intraperitoneal injection of DEX at 5 and 10 mg/kg/d exhibited significant anti-inflammatory effects in acute lung injury [27]. In another mouse experiment, DEX 1 mg/kg/d for three days effectively treated allergic airway inflammation [28]. In this study, DEX 2.5 mg/kg/d in combination with HFD for 30 days reduced liver TG and TC levels but enhanced epididymal adipose lipid metabolism and induced an enlargement of epididymal adipocytes. These data indicated that adipocyte enlargement and increased lipid metabolism can induce obesity. Obesity induces disorders of hepatic lipid and glucose metabolism, which can lead to the development of metabolic syndromes and a series of diseases over time. These findings are of good clinical relevance because many patients receiving GC treatment might be on HFD concurrently.
Excessive GC secretion (Cushing’s syndrome) causes a redistribution of fat and an increase in visceral fat [29]. BW change after GC treatment is attributed to different responses to GC [30]. A previous study depicted that BW changes after GC treatment were caused by different responses to varying degrees of GC stimulation, reducing bone density [30]. In another experiment, femur length was reduced in mice treated with 5 mg/kg/d DEX [13]. An increase in adipose tissue mass can be achieved by an increase in adipocyte size and number [31]. In this study, DEX treatment increased food intake in mice, which was attributed to the catabolism promotion of carbohydrates, proteins, and substances by DEX. DEX treatment induced a significant increase of AW/BW but inhibited the BW gain in mice, which was related to bone loss and growth inhibition by GC.
The YAP signaling pathway is crucial for controlling organ tissue size [32,33]. In a mouse model, DEX at 50 mg/kg inhibited hepatocyte proliferation in mice [21]. In this study, the YAP protein level was increased by DEX treatment under a ND. PCNA protein level was downregulated after DEX treatment under ND and HFD conditions. The Pcna mRNA was decreased after DEX treatment under HFD. The levels of Ki67 and Cyclin B2 mRNA were reduced by DEX treatment under ND and HFD. These data suggested DEX enlarged epididymal adipocytes due to its effects on lipid accumulation but not the epididymal adipocyte proliferation.
Angptl8, Fabp4, and Fasn regulate adipocyte lipid metabolism [34–36]. In this study, DEX treatment increased epididymal fat TG level in HFD-fed mice. It also upregulated Fabp4 mRNA expression, which was more pronounced in HFD-treated mice. HFD downregulated the Angptl8 mRNA level in epididymal adipose tissue. DEX treatment upregulated Fasn mRNA level, whereas HFD treatment downregulated Fasn mRNA level. DEX 2.5 mg/kg/d enhanced fatty acid uptake and synthesis but did not affect lipid clearance in mouse epididymal adipocytes. These modifications led to epididymal adipocyte enlargement. Long-term use of DEX is used in treating anti-inflammatory, anti-allergic, arthritic, oncological, and infectious diseases [5]. Despite its therapeutic effect on many diseases, DEX is associated with several serious side effects, such as osteoporosis, obesity, hyperglycemia, hyperlipidemia, and risk of infection due to immunosuppression [37]. Based on these data, HFD should be avoided in patients receiving long-term DEX therapy.
The reported effects of DEX on hepatic lipid metabolism are diverse. Its application in NAFLD has not been suggested. DEX at 1–50 mg/kg/d resulted in hepatic lipid accumulation, whereas DEX at 0.05–0.5 mg/kg/d decreased hepatic TG. In this study, intraperitoneal injection of DEX 2.5 mg/kg/d for 30 days reduced hepatic TG/TC and fatty vacuoles in HFD-fed mice. This regime also downregulated Fabp1 and Plin2 mRNA levels and upregulated Angptl8 and Hsl mRNA levels. These modifications indicated that DEX treatment attenuated hepatic lipid storage in HFD-fed mice.
Subcutaneous injection of DEX (4 mg/kg) every two days for two months suppressed inflammation [38]. However, intraperitoneal injection of 1–2 mg DEX for 15 days did not eliminate the inflammatory process, suggesting the need to modify the DEX regime [39]. In this study, DEX treatment decreased Il-1β, Ccl2, Tnf-α, and Il-2 mRNA levels in the liver. These data suggested that DEX treatment suppressed inflammatory reactions in the liver. Considering this anti-inflammatory effect, DEX (2.5 mg/d) may be translated as a therapy for NAFLD progression. However, the optimal dose regimen of DEX for treating NAFLD remains to be explored in animal experiments, and clinical trials are warranted to verify these points.
In conclusion, DEX 2.5 mg/kg/d induced enlargement of epididymal adipocytes in mice, which was more pronounced in combination with HFD. A warning of obesity development risk for DEX and HFD treatment patients is presented. Accordingly, patients on chronic GC medication are advised to avoid a high-calorie diet.
KEY MESSAGE
1. DEX 2.5 mg/kg/d induced enlargement of epididymal adipocytes in mice, and this effect was more pronounced in combination with HFD.
2. In HFD-fed mice, hepatic TG and TC levels were downregulated after DEX treatment, suggesting that DEX could be used to treat NAFLD.
3. A warning was presented that patients taking GCs should control high caloric intake to avoid the risk of obesity development.
Notes
CRedit authorship contributions
Mingli Su: conceptualization, data curation, writing - original draft; Ying Wang: conceptualization, data curation, writing - original draft; Zheng Yan: data curation, formal analysis; Jia Luo: data curation, formal analysis; Jie Yang: methodology; Hua Ye: methodology; Aiming Liu: investigation, writing - review & editing; Julin Yang: investigation, writing - review & editing
Conflicts of interest
The authors disclose no conflicts.
Funding
This study was supported by the Natural Science Foundation of Zhejiang Province (Y24H030004), the Ningbo Science and Technology Project (2019C50100), and the Natural Science Foundation of Ningbo (2023J072).

