High vegetable consumption and regular exercise are associated with better quality of life in patients with gout
Article information

Abstract
Background/Aims
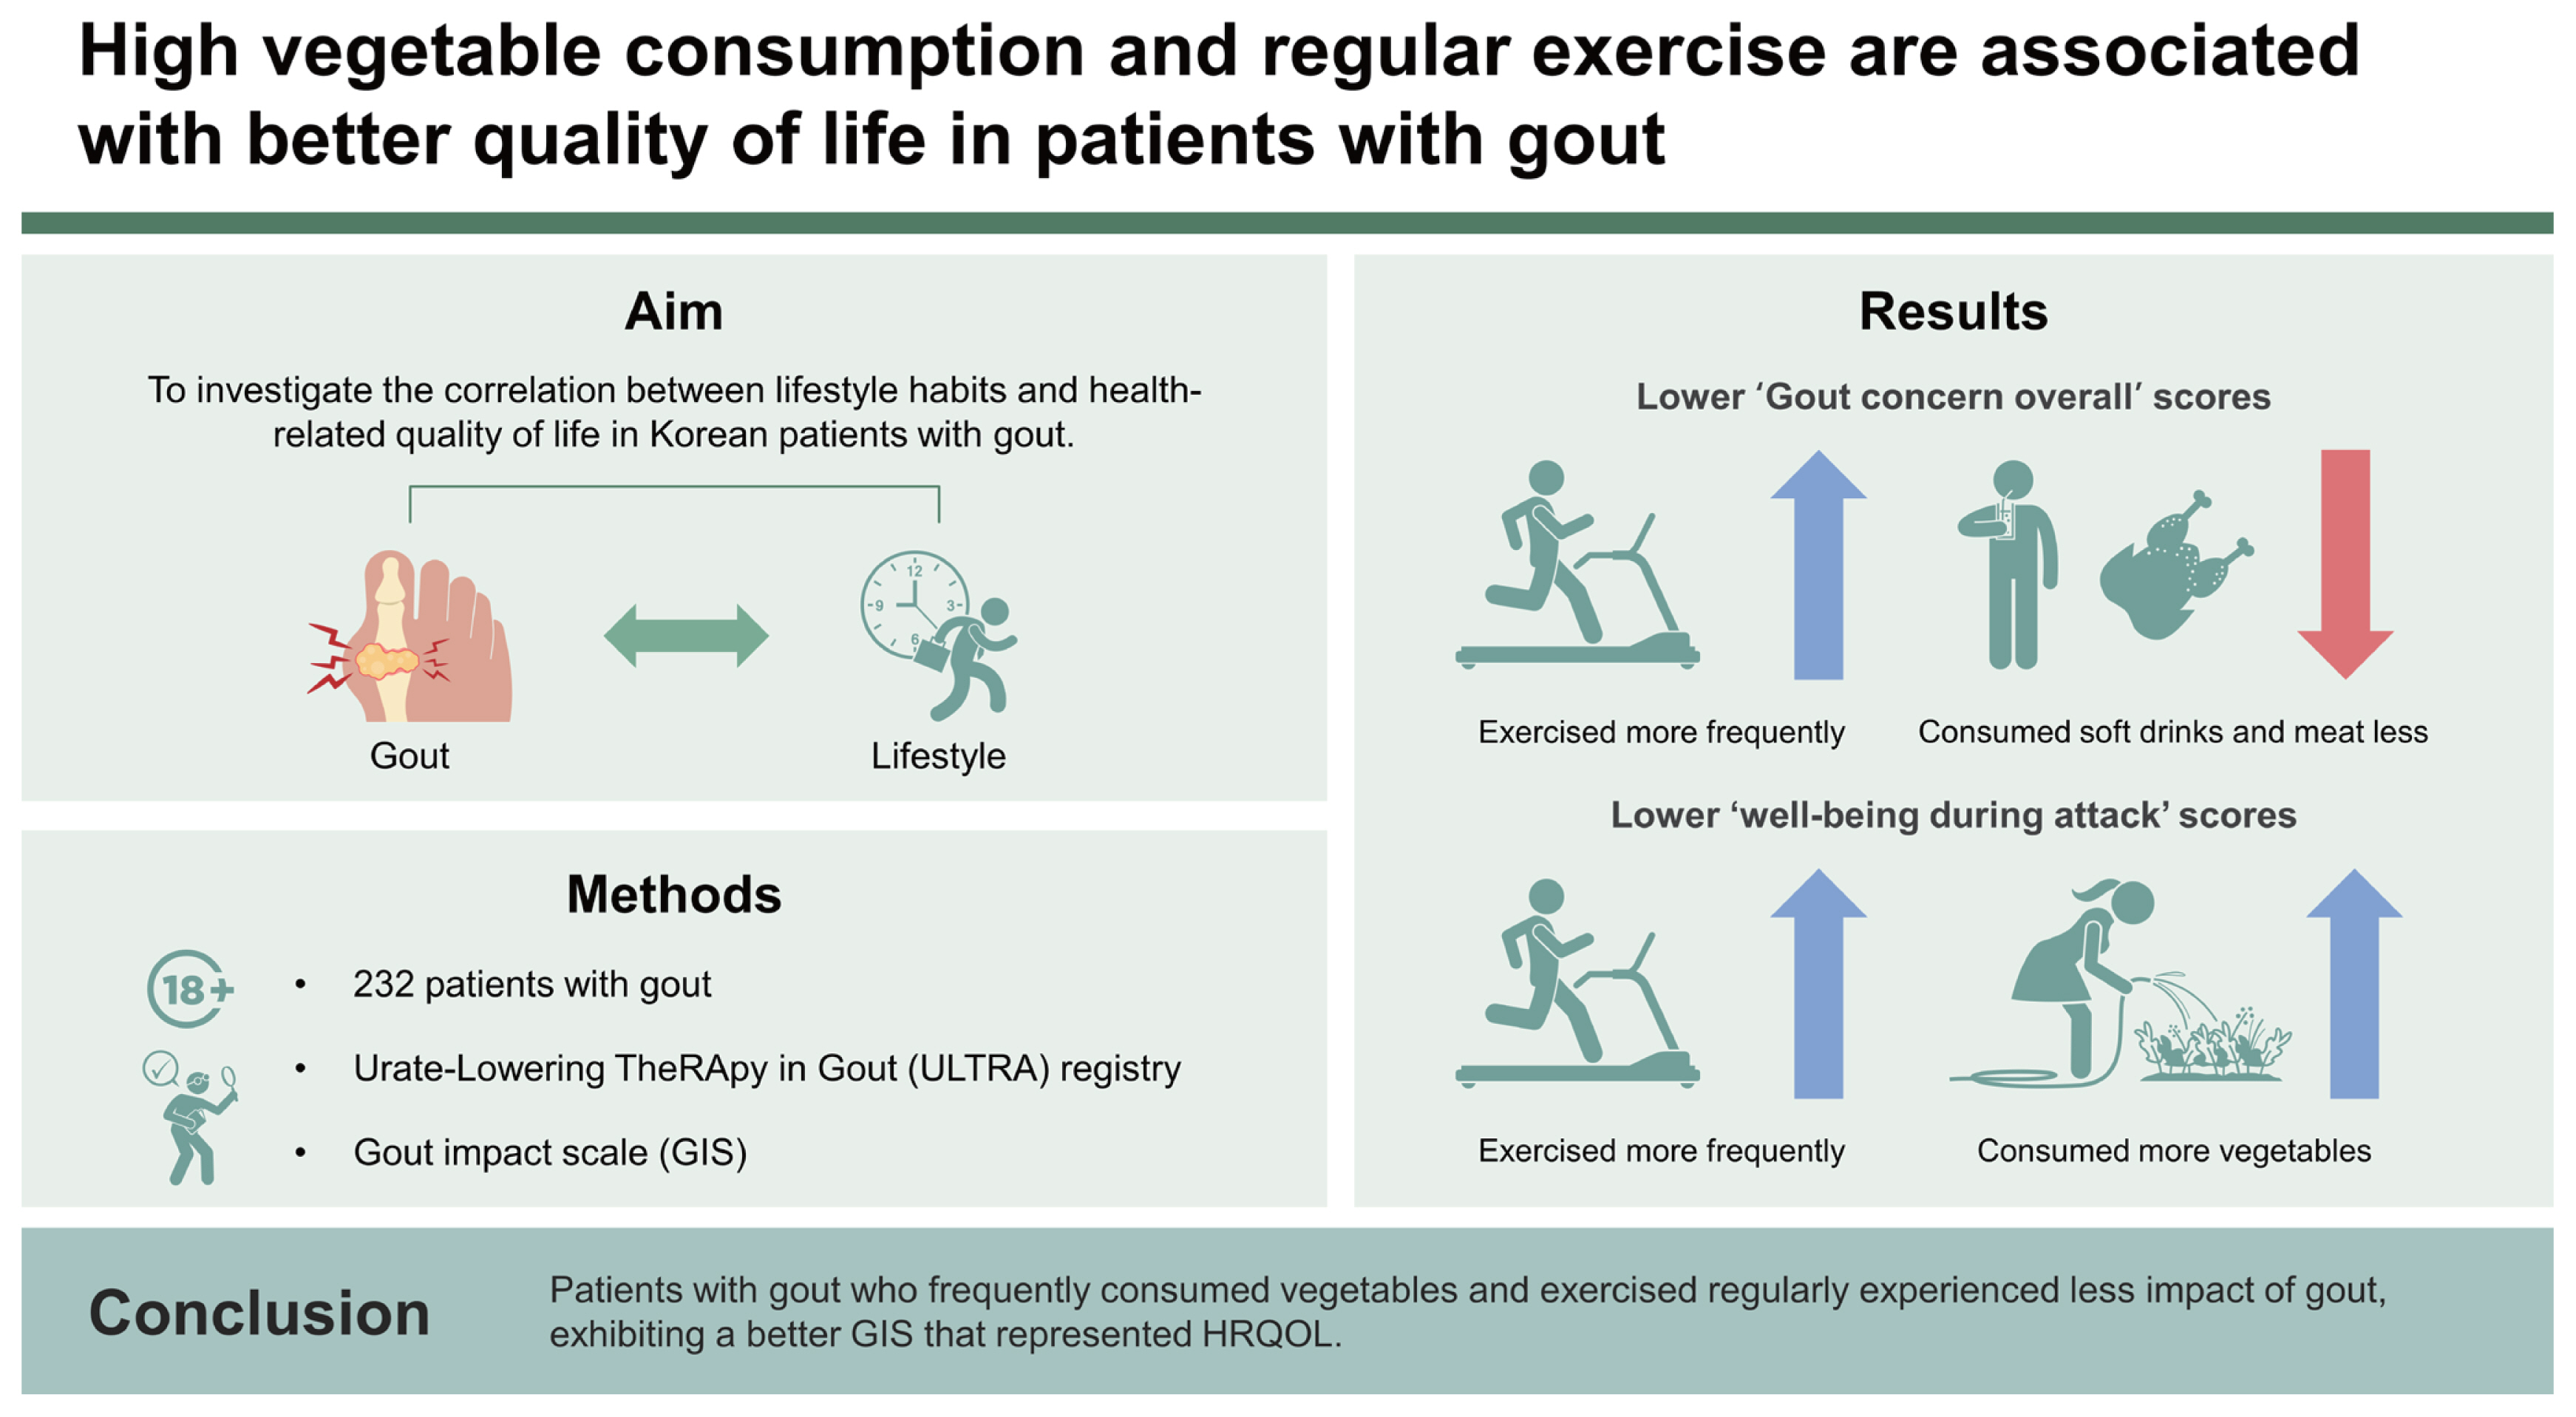
The Gout Impact Scale (GIS), a part of the Gout Assessment Questionnaire 2.0, is used to measure gout-specific health-related quality of life (HRQOL). Although several studies have been conducted on the factors affecting the HRQOL of patients with gout, few have focused on lifestyle factors. This study aimed to investigate the correlation between lifestyle habits and HRQOL using the GIS in patients with gout.
Methods
We used data from the Urate-Lowering TheRApy in Gout (ULTRA) registry, a prospective cohort of Korean patients with gout treated at multiple centers nationwide. The patients were aged ≥18 years and met the 2015 American College of Rheumatology/European League Against Rheumatism gout classification criteria. They were asked to complete a GIS and questions regarding their lifestyle habits at enrollment.
Results
The study included 232 patients. ‘Gout concern overall’ scores in the GIS were significantly lower in patients who exercised more frequently and consumed soft drinks and meat less, and ‘well-being during attack’ scores were significantly lower in patients who consumed vegetables and exercised more frequently. The frequency of vegetable consumption had a negative linear relationship with the ‘well-being during attack’ and ‘gout concern during attack’ scores (p = 0.01, p = 0.001, respectively). The frequency of exercise had a negative linear relationship with the ‘gout concern overall’ and ‘gout concern during attack’ scores (p = 0.04 and p = 0.002, respectively).
Conclusions
Patients with gout who frequently consumed vegetables and exercised regularly experienced less impact of gout, exhibiting a better GIS that represented HRQOL.
INTRODUCTION
Gout, a prevalent form of inflammatory arthritis, is generally considered to be more effectively managed through medications and lifestyle changes than other types of inflammatory arthritis [1]. Patients with gout are recommended long-term urate-lowering therapy (ULT) as well as modification of their lifestyle habits, including dietary habits [2,3]. An improper lifestyle may hinder the control of gout and affect the quality of life of patients [4].
To date, several tools have been used to assess the health-related quality of life (HRQOL) of patients with gout, including the Health Assessment Questionnaire (HAQ), disability index of the HAQ, and 36-item Short-Form Survey [5]. However, because these tools are inadequate for assessing patients with less severe disease, more disease-specific assessment tools are required to determine the severity of gout in such patients. With an increasing focus on patient-reported outcomes related to gout, a gout-specific HRQOL measure, the Gout Assessment Questionnaire (GAQ) version 1.0, was developed in 2006 [6]. Subsequently, the GAQ version 2.0 and its subscale, the Gout Impact Scale (GIS), consisting of a section describing the impact of gout on HRQOL, were developed and used [6–13]. Recently, the Korean version of the GIS was validated regarding internal consistency and reliability among Korean patients with gout [11,14–17].
Several studies have been conducted on factors affecting the HRQOL of patients. However, only few of them have focused on the effects of lifestyle habits. Therefore, we aimed to analyze the correlation between lifestyle habits and HRQOL using the GIS in Korean patients with gout.
METHODS
Participants
For this study, we used responses of patients enrolled in the ‘aftermath of Urate-Lowering TheRApy in gout (ULTRA)’ registry [18]. The ULTRA registry is a prospective cohort of Korean patients with gout treated at multiple centers nationwide since September 2021. Patients with gout aged ≥ 18 years who fulfill the 2015 classification criteria for gout necessitating ULT were enrolled [19]. The enrolled patients had no history of receiving ULT within 4 weeks and met the following criteria: two or more gout flares in a year, erosions present in radiographs of the hands or feet, or other reasons for which ULT was deemed necessary.
The study protocol was reviewed and approved by the Institutional Review Board of Kangwon National University Hospital (approval no.: KNUH_2023-05-006). This study was conducted in accordance with good clinical practice and the principles of the Declaration of Helsinki. Written informed consent was obtained from all participants in the ULTRA registry and for secondary research at the time of enrollment.
Clinical variables of participants
The case report form lists demographic and clinical data, including the number of attacks, comorbidities, lifestyle habits, medications, quality of life (using the GIS questionnaire), EuroQol 5-Dimension (EQ-5D) scale score, laboratory results, including serum urate level, and radiological results. Laboratory results were collected on the ULTRA registry enrollment date (baseline assessment, day 0).
Patients completed the EQ-5D to assess generic HRQOL, as validated for the Korean population [20,21] on their enrollment date (baseline assessment, day 0). The EQ-5D consists of five domains: mobility, self-care, usual activities, pain/discomfort, and anxiety/depression, each assessed using a single item with response levels of ‘no problem,’ some problem,’ and ‘extreme problem.’ The EQ-5D score was determined using an EQ-5D value set that was developed based on the preferences of the Korean population for EQ-5D-related health conditions [20–23].
Lifestyle habits were also investigated at enrollment (baseline assessment, day 0) using a specially designed questionnaire. Each item was evaluated and categorized on a scale of 2–3. The consumption of alcohol, coffee, soft drinks, meat, dairy products, vegetables, and fruits per week as well as the number of exercise sessions performed per week was also assessed. All patients underwent blood tests for a complete blood count and routine chemistry panel including urate, urine analysis, C-reactive protein concentration, and erythrocyte sedimentation rate.
GIS
The GIS questionnaire comprises 24 items related to 5 distinct subscales: (1) gout concern overall (questions Q1 a–d), (2) gout medication side effects (Q1 e, k), (3) unmet gout treatment needs (Q1 i, l, m), (4) well-being during attack (Q2–d, Q3–g), and (5) gout concern during attack (Q1 f–h, j). All GIS response options were provided on a 5-point Likert scale (e.g., from strongly agree to strongly disagree or from all of the time to none of the time). The GIS response options 1–5 were converted to a scale of 100–0 (1 = 100, 2 = 75, 3 = 50, 4 = 25, and 5 = 0) for Q1 a–h, j–l, and 2 a–d, and a scale of 0–100 (1 = 0, 2 = 25, 3 = 50, 4 = 75, and 5 = 100) for Q1 i, m, and 3 a–g. The 5 GIS subscale scores were calculated as the average scores of the questions included in each GIS subscale (Supplementary Table 1). The overall GIS score was calculated as the average score of all 24 questions. A higher subscale score indicated a more severe condition or more significant impact of gout [17,24,25]. Patients were asked to complete the lifestyle questionnaire on their ULTRA registry enrollment date (baseline assessment, day 0).
Statistical analysis
Descriptive statistics were used for all variables. Categorical variables are presented as percentages and frequencies, whereas continuous variables are presented as means and standard deviations (SDs). Pearson’s correlation analysis was conducted to verify the correlation between the EQ-5D-3L and GIS.
A two-tailed Student’s t-test was conducted to examine differences in GIS scores between subgroups according to gout-specific characteristics. A two-sided p value of < 0.05. was considered significant. The variables categorized into several scales for each item were converted into continuous variables according to the degree of the scale in the linear regression analysis. We evaluated the linear relationship between the GIS subscales and lifestyle habits using a multiple linear regression analysis. First, a simple linear regression analysis was performed using the number of times coffee, soft drinks, meat, dairy, vegetables, and fruit were consumed as independent variables. Subsequently, a stepwise linear regression analysis was performed by selecting significant items in the simple regression analysis. Chi-square tests were conducted to determine whether the presence of malignancy and the number of comorbidities varied based on vegetable consumption frequency and exercise frequency. All statistical analyses were performed using the SPSS Statistics software (version 26.0; IBM Corp., Armonk, NY, USA).
RESULTS
Baseline characteristics of patients
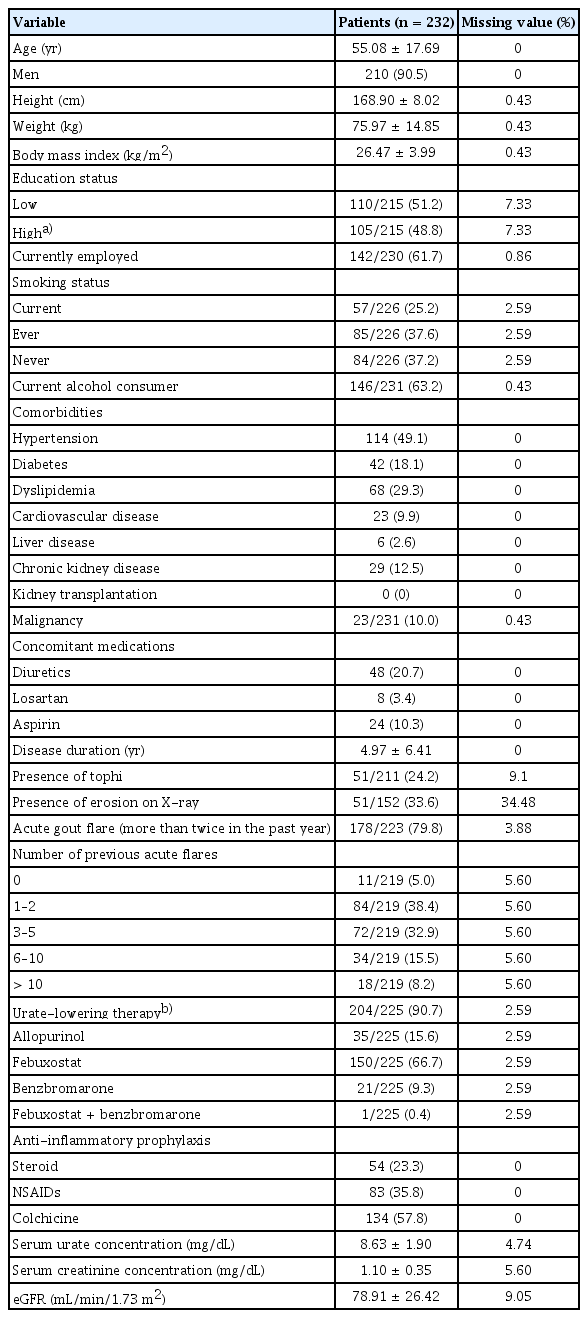
The study included 232 patients whose baseline characteristics are presented in Table 1. The mean ± SD age was 55.08 ± 17.69 years, and 90.5% of the patients were men. The disease duration was 4.97 ± 6.41 years. Overall, 48.8% of the patients had a bachelor’s degree or higher, and 61.7% were employed. Most patients (90.7%) received ULT, and the mean serum urate concentration was 8.63 ± 1.90 mg/ dL. Approximately 24.2% of the patients had tophi, while 79.8% reported experiencing acute gout flares more than twice a year. Hypertension was the most prevalent comorbidity, affecting 49.1% of the patients, followed by hyperlipidemia (29.3%), diabetes (18.1%), and chronic kidney disease (12.5%). Of the total patients, 10.0% had a history of malignancy.
Baseline characteristics of patients
GIS subscale and EQ-5D-3L scores
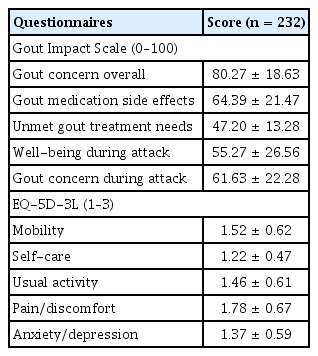
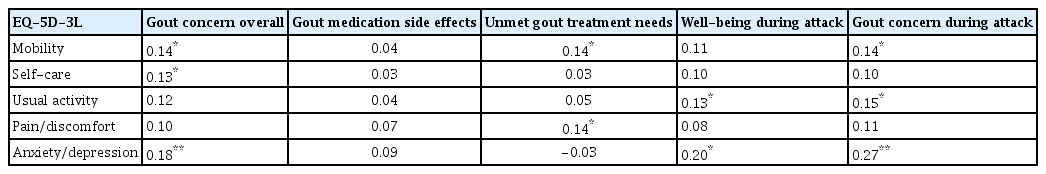
The mean scores for each GIS subscale (ranging from 0 to 100) at their enrollment date were as follows: 80.27 ± 18.63 for gout concern overall; 64.39 ± 21.47 for gout medication side effects; 47.20 ± 13.28 for unmet gout treatment needs; 55.27 ± 26.56 for well-being during attack; and 61.63 ± 22.28 for gout concern during attack (Table 2). The EQ-5D-3L mobility exhibited significant correlations (0.14 with the gout concern overall, 0.14 with unmet gout treatment needs, and 0.14 with gout concern during attacks). Overall, self-care exhibited significant correlations (0.13 with gout concern and usual activity demonstrated correlations of 0.13 with the well-being during attack, 0.15 with gout concern during the attack). The pain/discomfort item in the EQ-5D-3L indicated a significant correlation with the unmet gout treatment needs subscale in the GIS. Anxiety/depression exhibited significant correlations of 0.18 with the gout concern overall, 0.20 with well-being during attack, and 0.27 with gout concern during attacks (Table 3).
Patient-reported outcome measurements
Pearson correlation for Gout Impact Scales with EQ-5D-3L
GIS subscale scores according to clinical feature and lifestyle factors
Table 4 summarizes the differences in GIS subscale scores according to lifestyle habits. The ‘gout concern overall’ score differed between the group that consumed soft drinks less than three times a week and those that consumed soft drinks at least three times a week (78.97 ± 18.95 vs. 85.57 ± 16.24, p = 0.04). Patients who ate meat less than three times a week had a lower ‘gout concern overall’ score than those who consumed meat at least three times a week (78.08 ±19.97 vs. 83.25 ± 16.28, p = 0.04). Patients who exercised at least three times a week had a lower ‘gout concern overall’ score than those who exercised less than three times a week (76.07 ± 21.29 vs. 81.89 ± 17.29, p = 0.03).
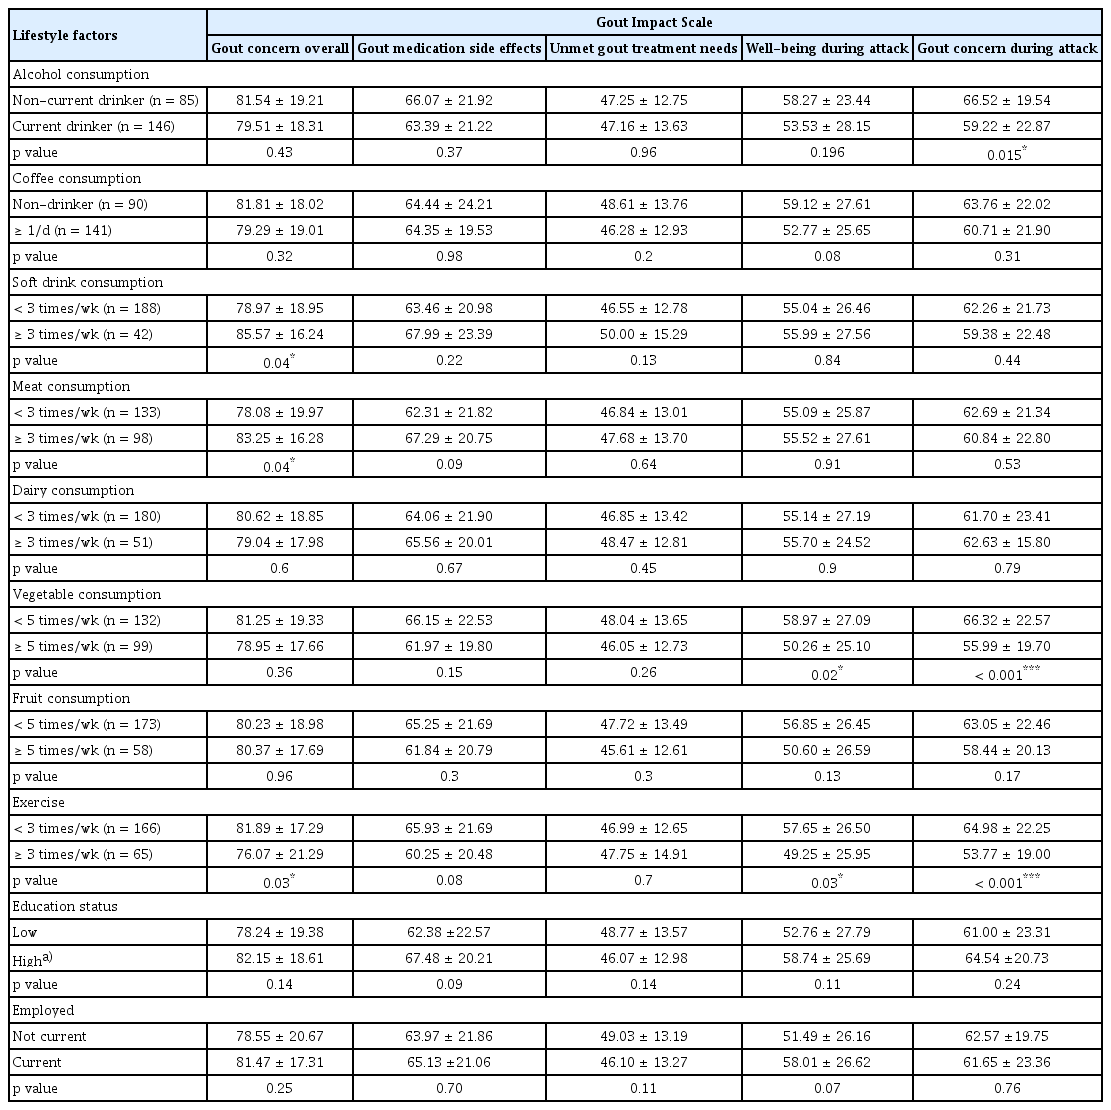
Gout Impact Scale subscale scores according to lifestyle factors
The ‘gout medication side effects’ and ‘unmet gout treatment needs’ scores did not significantly differ according to lifestyle factors. Patients who consumed vegetables less than five times a week had a higher ‘well-being during attack’ score than those who consumed vegetables at least five times a week (58.97 ± 27.09 vs. 50.26 ± 25.10, p = 0.02). Patients who exercised at least three times a week had a lower ‘well-being during attack’ score than those who exercised less than three times a week (49.25 ± 25.95 vs. 57.65 ± 26.50, p = 0.03).
Patients who consumed vegetables less than five times a week had a higher ‘gout concern during attack’ score than those who consumed vegetables at least five times a week (66.32 ± 22.57 vs. 55.99 ± 19.70, p < 0.001). Patients who exercised at least three times a week had a lower ‘gout concern during attack’ score than those who exercised less than three times a week (53.77 ± 19.00 vs. 64.98 ± 22.25, p < 0.001).
Patients who experienced three or more gout attacks in the past year exhibited significantly higher GIS scores in ‘gout concern overall,’ ‘gout medication side effects,’ ‘well-being during attack,’ and ‘gout concern during attack’ subscales. Additionally, in the group where serum urate levels were >6 mg/dL, significantly higher GIS scores were observed in the ‘gout medication side effects’ and ‘unmet gout treatment needs’ subscales (Supplementary Table 2).
According to the chi-square results, no significant differences in vegetable consumption or exercise frequency were observed based on the presence of a history of malignancy or the number of comorbidities (p = 0.33, 0.77, 0.09, and 0.24, respectively) (Supplementary Table 3, 4).
Multiple linear regression analysis of lifestyle factors and GIS subscale scores
Table 5 displays the results of the multiple regression analysis of the GIS subscale scores for vegetable consumption and exercise. The ‘gout concern overall’ score was negatively correlated with exercise frequency (β = −0.14, 95% CI = −11.08 to −0.34, p = 0.04). The ‘well-being during attack’ score was negatively correlated with vegetable consumption (β = −0.17, 95% CI = −15.89 to −1.90, p = 0.01). The ‘gout concern during attack’ score was negatively correlated with vegetable consumption and exercise frequency (β = −0.22 and −0.20, 95% CI = −15.24 to −4.16 and −15.81 to −3.56, respectively; both p < 0.01).
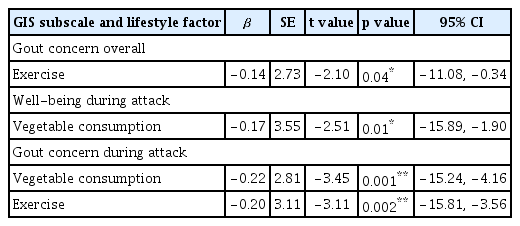
Stepwise multiple linear regression analysis of the K-GIS in gout patients
DISCUSSION
This study provides valuable information regarding the correlation between lifestyle factors and HRQOL in patients with gout. In this study, the correlation analysis revealed a relationship with the established quality of life assessment tool, EQ-5D-3L, demonstrating that the GIS is valid for evaluating the quality of life in patients with gout.
Several lifestyle factors demonstrated significant negative linear relationships with GIS subscale scores.
In a previous study, serum urate concentration, number of comorbidities, presence of bone erosion, and use of ULT were correlated with HRQOL in patients with gout [7]. Patients with higher urate concentrations (> 6 mg/dL) had higher ‘gout concern overall’ scores, and patients with more than three comorbidities had higher scores for ‘gout concern overall’ and ‘well-being during attack’ Patients who experienced more gout attacks had higher ‘gout concern during attack’ scores. Patients with bony erosions had higher ‘gout concern overall’ scores [7,16,17,20,21]. As previously observed in earlier results, the overall GIS score was higher in groups with elevated serum urate levels and those who experienced numerous gout attacks in the past year [17]. Additionally, eating habits (consumption of soft drinks, meat, and vegetables) and regular exercise were significantly related to HRQOL, specifically gout concern overall, well-being during an attack, and gout concern during an attack. No significant differences in vegetable consumption frequency or exercise frequency based on the presence of a history of malignancy or the number of comorbidities (Supplementary Table 3, 4). However, side effects of gout medication and unmet gout treatment needs were not significantly correlated with lifestyle habits. These subscales are related to therapeutic intervention, including drug administration, drug response, and side effects [16,24,25]. Hence, lifestyle habits may be more directly related to quality of life than to drug-related HRQOL.
Our results suggest that regular vegetable consumption and exercise can affect HRQOL in patients with gout. According to a previous study, moderate intake of purine-rich vegetables was not associated with an increased risk of gout [26]. Not all vegetables worsen gout; consumption of vegetables, even those high in purines, such as spinach and asparagus, reportedly does not increase the risk of gout attacks [27]. Moreover, vegetables contain many beneficial ingredients that control gout, including vitamin C, catechin, flavonoids, other antioxidants, potassium, and fiber [28]. Vitamin C eliminates reactive oxygen species released by urate [29–31]. Potassium lowers blood pressure by improving endothelium-dependent vasodilation. Antioxidant effects of catechins and flavonoids exhibit anti-oxidative effects [27]. Our research proves that higher vegetable consumption is related to a better quality of life in patients with gout.
In our study, coffee consumption was not associated with the HRQOL. To date, no studies have indicated that coffee consumption directly affects the quality of life of patients with gout. A meta-analysis has revealed that coffee can lower urate levels and prevent gout attacks [32]. Thus, although coffee may affect urate concentrations in the blood, it does not seem to contribute to gout-related quality of life. In this study, the ‘gout concern during attack’ value in non-current drinkers (never or past drinkers) was significantly higher than in current drinkers in the GIS subscale. Patients with high ‘gout concern during attack’ scores may have refrained from or stopped drinking because of concerns regarding gout attacks. These findings are consistent with those of a previous study. Chandratre et al. have reported that infrequent or non-drinkers had worse quality of life compared with daily alcohol drinkers [33]. Low-to-moderate exercise reduces inflammation and pain in patients with gout by downregulating TLR2 and CXCL1 expressions [34]. Our study confirmed that regular exercise improved the quality of life in patients with gout.
To the best of our knowledge, this is the first multicenter study to reveal the correlation between GIS scores and lifestyle factors in Korean patients with gout. We identified a negative correlation between GIS score and vegetable consumption. A negative correlation was also observed between GIS scores and regular exercise. Since this was a cross-sectional study, the explanation for the direct causal relationship is limited. Nevertheless, the study findings can suggest a relationship between quality of life and lifestyle. Therefore, we advised the patients to exercise and eat vegetables more frequently. Meanwhile, our study has several strengths. The questionnaires used in this study were specific to lifestyle habits including exercise frequency and consumption of alcohol, coffee, soft drinks, meat, dairy products, vegetables, and fruits. Thus, clinicians should encourage patients with gout to consume more vegetables and exercise regularly. Few tools are available to control gout flares. Nevertheless, our research may help patients improve their quality of life through lifestyle modifications. However, this study has several limitations. Statistical analysis in this study was conducted based on the frequency of exercise and food and drink consumption but not on the degree/amount. Therefore, further research is required to determine whether the degree of exercise and the amount of food or drink consumed are related to HRQOL in patients with gout. Another limitation is that our results revealed a negative relevance; however, additional data and elements may be required to explain a clear causal relationship.
In conclusion, this study presents objective data on how patients with gout can manage their quality of life daily. Specifically, increasing vegetable consumption and exercise could potentially contribute to improving patients’ quality of life.
KEY MESSAGE
1. Eating habits (consumption of soft drinks, meat, and vegetables) and regular exercise were significantly related to HRQOL, specifically gout concern overall, well-being during an attack, and gout concern during an attack.
2. Higher vegetable consumption is related to a better quality of life in patients with gout. Regular exercise improved the quality of life in patients with gout.
3. This study presents objective data on how patients with gout can manage their quality of life daily. Specifically, increasing vegetable consumption and exercise could potentially contribute to improving patient’s quality of life.
Notes
CRedit authorship contributions
Hyunsue Do: conceptualization, formal analysis, writing - original draft, writing - review & editing, funding acquisition; Hyo Jin Choi: writing - review & editing; Byoongyong Choi: writing - review & editing; Chang-Nam Son: writing - review & editing; Sang-Hyon Kim: writing - review & editing; You-Jung Ha: writing - review & editing; Ji Hyoun Kim: writing - review & editing; Min Jung Kim: writing - review & editing; Kichul Shin: writing - review & editing; Hyun-Ok Kim: writing - review & editing; Ran Song: writing - review & editing; Sung Won Lee: writing - review & editing; Joong Kyong Ahn: writing - review & editing; Seung-Geun Lee: writing - review & editing; Chang Hoon Lee: writing - review & editing; Kyeong Min Son: writing - review & editing; Ki Won Moon: conceptualization, data curation, writing - review & editing, funding acquisition
Conflicts of interest
The authors disclose no conflicts.
Funding
This research was supported by a grant from the Patient-Centered Clinical Research Coordinating Center funded by the Ministry of Health & Welfare, Republic of Korea (grant number: HC21C0010) and a 2023 Kangwon National University Hospital Grant (no. KNUH_2023-05-006).