Prognostic significance of sequential 18F-FDG PET/CT during frontline treatment of peripheral T cell lymphomas
Article information

Abstract
Background/Aims
The prognostic significance of 18F-fluorodeoxyglucose (FDG)-positron emission tomography-computed tomography (PET/CT) in peripheral T-cell lymphomas (PTCLs) are controversial. We explored the prognostic impact of sequential 18F-FDG PET/CT during frontline chemotherapy of patients with PTCLs.
Methods
In total, 143 patients with newly diagnosed PTCLs were included. Sequential 18F-FDG PET/CTs were performed at the time of diagnosis, during chemotherapy, and at the end of chemotherapy. The baseline total metabolic tumor volume (TMTV) was calculated using the the standard uptake value with a threshold method of 2.5.
Results
A baseline TMTV of 457.0 cm3 was used to categorize patients into high and low TMTV groups. Patients with a high TMTV had shorter progression-free survival (PFS) and overall survival (OS) than those with a low TMTV (PFS, 9.8 vs. 26.5 mo, p = 0.043; OS, 18.9 vs. 71.2 mo, p = 0.004). The interim 18F-FDG PET/CT response score was recorded as 1, 2–3, and 4–5 according to the Deauville criteria. The PFS and OS showed significant differences according to the interim 18F-FDG PET/CT response score (PFS, 120.7 vs. 34.1 vs. 5.1 mo, p < 0.001; OS, not reached vs. 61.1 mo vs. 12.1 mo, p < 0.001).
Conclusions
The interim PET/CT response based on visual assessment predicts disease progression and survival outcome in PTCLs. A high baseline TMTV is associated with a poor response to anthracycline-based chemotherapy in PTCLs. However, TMTV was not an independent predictor for PFS in the multivariate analysis.

INTRODUCTION
Peripheral T-cell lymphomas (PTCLs) account for 10% of all non-Hodgkin lymphomas and have a variable but generally poor prognosis. For more than 10 years, the standard frontline treatment for PTCLs has involved anthracycline-based chemotherapy, including cyclophosphamide, vincristine, doxorubicin, and prednisolone with or without etoposide; cyclophosphamide, doxorubicin, vincristine, and prednisolone (CHOP); or cyclophosphamide, doxorubicin, vincristine, etoposide, and prednisolone (CHOEP). In PTCLs, the treatment response to CHOP/CHOEP is 50–65%, with a short duration of remission. As a result, a significant proportion of patients eventually relapse, with a 5-year overall survival (OS) rate of about 30% [1–3].
The usefulness of 18F-fluorodeoxyglucose (18F-FDG) positron emission tomography-computed tomography (PET/CT) in the initial staging and response assessment is well established in many subtypes of aggressive lymphoma. Achievement of molecular response on interim PET/CT after two to four courses of chemotherapy represents a favorable clinical outcome in Hodgkin lymphoma and diffuse large B-cell lymphoma [4–6]. International guidelines recommend the use of the 5-point Deauville scale (DS), incorporating the Deauville criteria, for response assessment of lymphoma [7]. FDG uptake is evaluated relative to the reference regions of normal mediastinum and liver, with uptake less than that of the liver (DS ≤ 3) indicating a complete metabolic response. Recently, baseline quantitative PET parameters have been investigated as predictors of prognosis in diffuse large B-cell lymphoma. In particular, a high baseline total metabolic tumor volume (TMTV) is a strong predictor of progression-free survival (PFS) and OS in diffuse large B-cell lymphoma and Hodgkin lymphoma [8–10]. However, PTCLs have variable FDG avidity depending on subtypes or sites of extranodal involvement. Therefore, the prognostic relevance of baseline and interim PET/CT is unclear. Previous studies of the usefulness of interim PET in PTCLs have reported contradictory results. Some studies have found that interim PET can predict the response to therapy in PTCL patients, with a positive interim PET predicting a poor clinical outcome [11,12]. Conversely, another study demonstrated that interim PET does not provide additional information beyond that obtained from traditional staging methods, such as CT and bone marrow biopsy [13]. In the present study, we evaluated the usefulness of FDG PET in the management and prognostication of PTCLs.
METHODS
Patient characteristics and frontline treatment
This retrospective study included patients with a histological diagnosis of PTCL according to the 2008 World Health Organization classification criteria between February 2006 and March 2022. Patients with the histological subtypes of cutaneous T-cell lymphoma or extranodal NK/T-cell lymphoma were excluded. The included patients were treated with six cycles of anthracycline-containing chemotherapy: CHOP, CHOEP, or alemtuzumab-CHOP. Patients treated with frontline brentuximab vedotin were excluded. The Ann Arbor staging system was used for disease staging, whereas the International Prognostic Index (IPI) and prognostic index for T-cell lymphoma (PIT) were used for risk stratification [14,15]. The study protocol was approved by the Institutional Review Board of Chonnam National University Hwasun Hospital (CNUHH-2022–095). The study was conducted in accordance with the Declaration of Helsinki. The requirement for obtaining informed consent was waived owing to the study’s retrospective nature.
18F-FDG PET/CT assessment
Baseline and interim 18F-FDG PET/CT were performed before starting chemotherapy and after three cycles of chemotherapy according to the institutional practice. Final responses were assessed after more than 1 month of completing the frontline treatment using 18F-FDG PET/CT and contrast-enhanced CT. 18F-FDG PET/CT was performed using a Discovery ST PET/CT system (GE Healthcare, Madison, WI, USA), consisting of a bismuth germinate scanner and a 16-detector-row CT scanner. The patients fasted for 6 h prior to the intravenous administration of 18F-FDG (7.4 MBq per body weight) to ensure serum glucose level < 130 mg/mL. At 60 minutes after 18F-FDG administration, low-dose CT (120 KV, automated from 10 to 130 mA, 512 × 512 matrix, 50 cm field of view, 3.75 mm slice thickness, and rotation time of 0.8 s) was performed extending from the skull base to the proximal thighs. Immediately following CT acquisition, PET emission scans were acquired in the same anatomical locations using a 15.7 cm axial field of view acquired in two-dimensional mode with a 128 × 128 matrix. The images were reconstructed using a conventional iterative algorithm (ordered subsets-expectation maximization, OSEM). A workstation (Xeleris; GE Healthcare, Milwaukee, WI, USA) providing multi-planar reformatted images was used for image analysis.
To define the tumor margins around the target lesions, a cut-off standardized uptake value (SUV) of 2.5 was used, in accordance with previous studies [16–18]. The tumor area in PET/CT was delineated using a circle that encompassed regions with an SUV ≥ 2.5. The metabolic tumor volume (MTV) 2.5 was determined using the AW Volume Share™ workstation (GE Healthcare) on fused PET/CT images [19–21]. The active MTV2.5 was measured in three dimensions by selecting the volume of interest on the axial image, followed by manual adjustment of the size of the volume of interest on the corresponding coronal and sagittal images to include the entire active tumor. Bone marrow involvement was defined as focal hypermetabolism; however, diffuse hypermetabolism within the bone marrow was not included. Spleen involvement was considered to be present if focal hypermetabolism was found or if diffuse hypermetabolism with reversal of the normal hepatosplenic ratio [22] was observed.
Response assessment
Interim PET/CT was assessed at 14–21 days after the third cycle of anthracycline-based chemotherapy, whereas the final PET/CT was assessed at least 1 month after the end of chemotherapy. PET/CT images were interpreted by two experienced nuclear medicine physicians to assess lesions in cross-sectional, coronal, and sagittal planes. The interim and baseline PET/CT images were subjected to visual assessment using the DS: 1, no uptake; 2, uptake ≤ mediastinum; 3, uptake > mediastinum but ≤ liver; 4, uptake moderately increased compared to the liver uptake at any site; and 5, markedly increased uptake compared to the liver at any site and new sites and/or new sites of disease.
Statistical analysis
PFS was defined as the time from diagnosis to disease progression or death from any cause. OS was defined as the time from diagnosis to death from any cause. The Kaplan–Meier method was used to estimate the PFS and OS, and the survival curves were compared using a log rank test. To evaluate the optimal cutoff value of TMTV for predicting the PFS, receiver-operating characteristic (ROC) curve analysis was performed. The cutoff value was calculated using the ROC curve for progression at the time of the median PFS. Using the Cox proportional-hazards model, univariate, and multivariate analyses were performed to estimate the relative risk factor events and associated 95% confidence intervals (CIs) for PFS and OS. Statistical analyses were performed using SPSS software (ver. 21; IBM Corp., Armonk, NY, USA). p values < 0.05 were considered indicative of statistical significance.
RESULTS
Patient characteristics and clinical outcomes
In total, 143 patients diagnosed with PTCL and treated with anthracycline-based chemotherapy between February 2006 and September 2022 were included in this study. Table 1 presents the clinical characteristics of the included patients. The median age of the patients was 67 years (range: 17–85 yr). The histological subtypes of PTCLs included PTCL, not otherwise specified (n = 55, 38.5%), angioimmunoblastic T-cell lymphoma (n = 50, 35.0%), anaplastic large cell lymphoma, anaplastic lymphoma kinase-negative (n = 15, 10.5%), anaplastic large cell lymphoma, anaplastic lymphoma kinase-positive (n = 12, 8.4%), enteropathy-associated T-cell lymphoma (n = 6, 4.2%), hepatosplenic T-cell lymphoma (n = 1, 0.7%), monomorphic epitheliotropic intestinal T-cell lymphoma (n = 2, 1.4%), and unspecified (n = 2, 1.4%). Using the Ann Arbor staging system, 108 patients (75.5%) were categorized as having an advanced stage, and bone marrow involvement with lymphoma was confirmed by bone marrow examination or 18F-FDG PET/CT in 38 patients (26.6%). Furthermore, 29 (20.3%) and 31 (21.7%) patients were assessed as being high risk by PIT and IPI, respectively. In total, 74 patients (51.7%) received CHOP, 68 (47.6%) received CHOEP, and 1 (0.7%) received alemtuzumab-CHOP.

Clinical characteristics of the patients (n = 143)
The median follow-up duration was 52.0 months (range: 3.8–153.9 mo). Following frontline treatment, 111 patients (77.6%) achieved a complete response, 16 (11.2%) achieved a partial response, 1 achieved stable disease (0.7%), and 15 achieved progressive disease (10.5%). Of the 127 patients who achieved a partial or better response following frontline treatment, 10 and 2 received upfront autologous and allogeneic stem cell transplantation, respectively. At the time of analysis, 81 patients (56.6%) had relapsed or progressed, and 63 (44.1%) had died. The median PFS was 24.6 months (95% CI = 11.302–37.832), and the median OS was 60.9 months (95% CI = 34.024–87.843). Supplementary Figure 1 presents the OS according to the PIT and IPI scores.
Baseline 18F-FDG PET/CT interpretation
The baseline TMTV was available for 126 patients. The median TMTV was 193.9 cm3 (range: 0.3–3,614.0 cm3). The area under the curve of the ROC curve analysis for TMTV was 0.606 (95% CI = 0.504–0.707, p = 0.051), and the cut-off TMTV was 457.0 cm3 (sensitivity = 45.0%, specificity = 74.0%). Based on the cut-off value, 46 patients were categorized in the high TMTV group (TMTV ≥ 457.0 cm3) and 80 were categorized in the low TMTV group (TMTV < 457.0 cm3). There were no significant differences in median age, histological subtype, bone marrow involvement, or treatment regimen between the high and low TMTV groups. However, the high TMTV group had a significantly higher proportions of advanced disease stage (91.3% vs. 68.8%, p = 0.001) and high-risk patients according to the PIT and IPI scores (PIT, 32.6% vs. 7.5%, p = 0.004; IPI, 45.6% vs. 12.6%, p < 0.001).
Patients in the high TMTV group had shorter PFS and OS compared to those in the low TMTV group (PFS: 9.8 vs. 26.5 mo, HR = 1.600, 95% CI = 1.010–2.671, p = 0.043; OS: 18.9 vs. 71.2 mo, HR = 2.135, 95% CI = 1.261–3.615, p = 0.004) (Fig. 1). Patients with a high TMTV had higher lactate dehydrogenase (LDH) level, more common B-symptoms, worse performance score, and greater extranodal involvement than those with low TMTV. The number of patients with bone marrow involvement did not differ between the high and low TMTV groups, and 68.8% of patients in the low TMTV group had advanced-stage disease (Supplementary Table 1).

Progression-free survival (A) and overall survival (B) according to the baseline total metabolic tumor volume (TMTV).
Interim and final 18F-FDG PET/CT response assessment
All 143 patients underwent interim 18F-FDG PET/CT analysis. The DS was used to analyze the images. Of these patients, 28 (19.6%), 33 (23.1%), 44 (30.8%), 26 (18.2%), and 12 (8.4%) had scores of 1–5, respectively. The end-of-treatment 18F-FDG PET/CT images were analyzed for 99 patients, of whom 45 (45.5%), 3 (3.0%), 17 (17.2%), 15 (15.2%), and 19 (19.2%) had DS scores of 1–5, respectively. The changes between interim and final PET/CT DS scores are presented in Supplementary Figure 2.
The PFS and OS differed significantly according to the interim PET/CT response based on the DS (PFS: 120.7 vs. 25.0 vs. 36.2 vs. 7.6 vs. 2.1 mo, p < 0.001; OS: not reached vs. not reached vs. 60.9 mo vs. 14.3 mo vs. 7.7 mo, p < 0.001) (Fig. 2). Furthermore, the PFS and OS were significantly different among the DS 1, DS 2–3, and DS 4–5 groups (PFS: 120.7 vs. 34.1 vs. 5.1 mo, p < 0.001; OS: not reached vs. 61.1 mo vs. 12.1 mo, p < 0.001). However, the PFS showed no significant differences between the DS 2 and DS 3 groups (25.0 vs. 36.2 mo, p = 0.745).

Progression-free survival (PFS) (A) and overall survival (OS) (B) according to the interim 18F-fluorodeoxyglucose (FDG)-positron emission tomography-computed tomography (PET/CT) response assessment using the 5-point Deauville scale (DS). PFS (C) and OS (D) according to the interim 18F-FDG PET/CT response assessment according to DS 1, 2–3, and 4–5.
With regard to the end-of-treatment 18F-FDG PET/CT, the PFS and OS were worse in patients with DS 4–5 than DS 1–3; however, there were no significant differences between DS 1 and DS 2–3 (PFS: 120.7 mo vs. not reached vs. 6.4 mo for DS 1, DS 2–3, and DS 4–5, respectively, p < 0.001; OS: not reached vs. not reached vs. 19.5 mo for DS 1, DS 2–3, and DS 4–5, respectively, p < 0.001) (Fig. 3). Of the 77 patients with an interim response of DS 2 or DS 3, 61 had available final 18F-FDG PET/CT data. In the final PET/CT images, 42 patients (61.9%) had achieved complete molecular response (DS 1–3), whereas 19 (26.3%) had not (DS 4–5). The PFS and OS were significantly different between patients who did and did not achieve a final complete molecular response (PFS: 59.9 vs. 7.2 mo, HR = 4.754, 95% CI = 2.267–9.971, p < 0.001; OS: not reached vs. 24.0 mo, HR = 3.706, 95% CI = 1.592–8.630, p = 0.001).

Progression-free survival (PFS) (A) and overall survival (OS) (B) according to end-of-treatment 18F-fluorodeoxyglucose (FDG)-positron emission tomography-computed tomography (PET/CT) response assessment using the 5-point Deauville scale (DS) in all patients. PFS (C) and OS (D) in patients who DS 2 or 3.
Univariate analysis showed that age and IPI, PIT, and DS scores in the interim PET/CT and baseline TMTV were significantly associated with the PFS and OS. In the multivariate analysis, only the DS score in interim PET/CT was associated with the PFS. Furthermore, age, and DS score in interim PET/CT were significantly associated with the OS (Table 2).
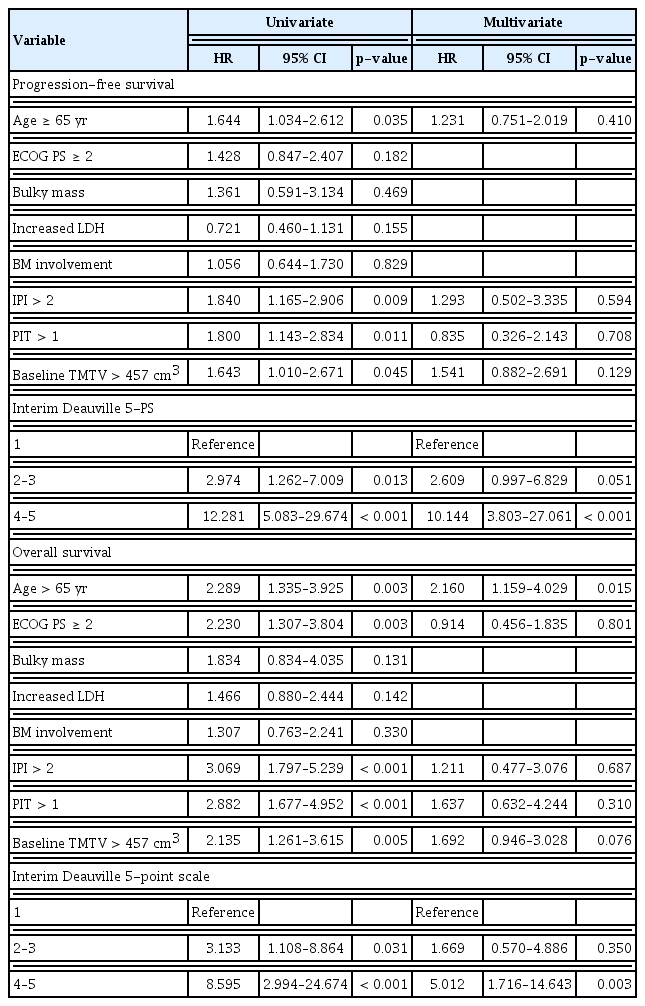
Prognostic factors affecting progression-free survival and overall survival
DISCUSSION
This study investigated the potential usefulness of sequential 18F-FDG PET/CT as a prognostic marker in PTCL. Patients with a high baseline TMTV showed worse PFS and OS than those with a low baseline TMTV. PFS and OS were significantly associated with the interim PET/CT response based on the DS score. In particular, patients who achieved DS 1 at the interim response assessment had significantly longer PFS and OS than those who achieved DS 2–3 (PFS: 120.7 vs. 34.1 mo, p = 0.008; OS: not reached vs. 61.1 mo, p = 0.023). Furthermore, patients who achieved a complete molecular response at the final response assessment had longer PFS and OS than those who did not.
Patients with PTCLs typically have a poor prognosis because of an incomplete response to frontline treatment and a lack of effective salvage treatment modalities. In addition, the existing prognostic scores, such as IPI, PIT, and International Peripheral T-cell Lymphoma Project scores (IPTCLP), have limited ability to predict the treatment response and clinical outcomes. As a result, more effective prognostic indicators are needed. Several efforts have been made to determine the prognostic impact of baseline PET parameters, such as SUV, MTV, and total lesion glycolysis (TLG). In general, a high SUV in PET/CT indicates the aggressiveness of lymphomas. However, SUVmax does not predict the prognosis of lymphomas [16]. Recent retrospective studies have demonstrated that baseline TMTV is a useful prognostic marker, with cut-off values based on ROC curve analysis of 125–514.6 cm3 [23–26]. The baseline TMTV reflects the tumor volume and predicts survival outcomes more effectively than the other baseline PET/CT parameters. Patients with a high baseline TMTV also have other adverse risk factors, such as a high LDH level, advanced-stage disease, multiple extranodal involvement, and high risk according to PIT and IPI scores. However, a significant proportion (68.8%) of patients with a low TMTV have advanced-stage disease. Furthermore, in the present study, there were no significant differences in bone marrow involvement between the low and high TMTV groups (23.8% vs. 39.1%, p = 0.100). It is unclear whether PET/CT can replace bone marrow biopsy. Certain previous studies have shown that the accuracy of PET/CT for the detection bone marrow involvement in PTCLs is low [27,28]. Bone marrow involvement is an important prognostic factor in PTCL. It is possible that the low prognostic ability of TMTV is due to the occurrence of bone marrow involvement in a significant proportion of patients with a low TMTV. Although PTCL is an FDG-avid lymphoma, the SUV varies between lesions, and the median baseline SUVmax is almost 8–10, which is lower than that of other FDG-avid lymphomas, such as Hodgkin lymphoma or diffuse large B-cell lymphoma [29,30]. Therefore, there may be a greater number of unmeasured lesions according to the SUV cut-off in PTCL than other lymphoma subtypes.
The end-of-treatment metabolic response is a prognostic marker in patients with PTCLs, similar to other lymphomas. However, the incidence of relapses after complete metabolic response is higher in PTCLs than in diffuse large B-cell lymphoma [12]. Previous retrospective studies have demonstrated that patients with interim PET negativity showed prolonged PFS and OS [11,12]. However, the prognostic impact of the DS score is unclear, and previous studies have shown conflicting results. In a retrospective study of 124 PTCL patients, which compared the end-of-treatment PET response in terms of survival outcomes, interim PET negativity (DS ≤ 3) did not predict the prognosis [13]. Subgroup analysis of the prospectively randomized PET-guided therapy of aggressive non-Hodgkin lymphomas (PETAL) trial demonstrated that DS 5 in interim PET was associated with a worse PFS (HR = 4.371, 95% CI = 2.073–9.187, p < 0.0001) and OS (HR = 4.371, 95% CI = 2.073–9.187, p < 0.0001). In the same study, patients who did not achieve a complete metabolic response (DS > 3) had shorter PFS (HR = 2.259, 95% CI = 1.121–4.552, p = 0.019) and OS (HR = 2.621, 95% CI = 1.247–5.503, p = 0.004); however, the HR was higher when the patients were categorized at DS 4 and 5 than at DS 3 and 4 [30]. In an interim PET/CT response analysis of a prospective cohort of 89 PTCL patients, DS scores 1–2 and 3–5 were stronger predictors of the prognosis than DS scores 1–3 and 4–5 [31]. In the present study, PFS was stratified according to DS scores 1, 2–3, and 4–5 based in interim PET/CT response. Among patients who had an interim response of DS 2–3, those with final responses of DS 4–5 had a similar PFS to those with an interim response of DS 4–5. The PFS of patients who achieved DS1 in interim PET/CT was better than those who achieved DS 2–3; these patients achieved complete metabolic response at the final response assessment (120.7 vs. 59.9 mo, p = 0.288). These results suggest that, although a significant proportion of patients with complete metabolic response in interim PET/CT eventually experience disease progression, a response of DS 1 in interim PET/CT is associated with a significantly improved survival outcome.
This study had several limitations. First, the follow-up duration varied from 6 months to 16 years, which could have introduced bias into our results. However, the patients received standardized treatment. In addition, differences due to variation in PET/CT machine, imaging protocol, and observers were minimal because the study was conducted in a single institution. Second, bone marrow biopsy was performed in only a few patients. Therefore, it is possible that the TMTV was unable to predict the outcomes because bone marrow involvement is not detected on baseline PET/CT. Third, the classification of PTCL subtypes has changed over time due to advancements in genetic analysis techniques, which may have influenced the prognosis. This study included heterogeneous subtypes of PTCLs, including anaplastic lymphoma kinase-positive anaplastic large cell lymphoma. The treatment response and survival were not compared among different subtypes because of the small number of patients with each subtype. Therefore, further studies are needed to verify our results.
In conclusion, a high baseline TMTV is associated with a poor response to anthracycline-based chemotherapy in PTCLs. However, TMTV was not an independent predictor for PFS in multivariate analysis. Interim PET/CT response based on visual assessment can predict disease progression and survival outcome following frontline treatment of PTCLs. In particular, patients with a DS 4 in interim PET/CT should receive alternative or intensified treatment.
KEY MESSAGE
1. Interim PET/CT response based on visual assessment is a valuable predictor of disease progression and survival outcomes following frontline treatment of PTCL.
2. A high baseline TMTV is associated with a poor response to anthracycline-based chemotherapy in PTCLs.
Notes
CRedit authorship contributions
Ga-Young Song: investigation, writing - original draft; Sung-Hoon Jung: writing - review & editing, supervision; Seo-Yeon Ahn: writing - review & editing, supervision; Mihee Kim: writing - review & editing, supervision; Jae-Sook Ahn: writing - review & editing, supervision; Je-Jung Lee: writing - review & editing, supervision; Hyeoung-Joon Kim: writing - review & editing, supervision; Jang Bae Moon: methodology, data curation; Su Woong Yoo: methodology, data curation; Seong Young Kwon: methodology, data curation; Jung-Joon Min: methodology, data curation; Hee-Seung Bom: methodology, data curation; Sae-Ryung Kang: methodology, data curation; Yang Deok-Hwan: conceptualization, investigation, supervision, funding acquisition
Conflicts of interest
The authors disclose no conflicts.
Funding
This study was supported by grants from the Korea Health Technology R&D Project through the Korea Health Industry Development Institute (KHIDI), funded by the Ministry of Health & Welfare, Republic of Korea (no. HR20C0021), and the Chonnam National University Hwasun Hospital Research Institute of Clinical Medicine (no. HCRI20011).
Availability of data and materials
The dataset is available from the corresponding authors upon reasonable request.