Association of the Superoxide Dismutase (V16A) and Catalase (C262T) Genetic Polymorphisms with the Clinical Outcome of Patients with Acute Paraquat Intoxication
Article information
Abstract
Background/Aims
Many patients with acute paraquat (PQ) intoxication die even at low PQ concentrations, whereas others with similar concentrations recover. Therefore, it is possible that individual differences in antioxidant capacity are responsible for the variable clinical outcome in patients with acute PQ intoxication.
Methods
We investigated whether there was a relationship between the genetic polymorphisms of SOD (V16A), catalase (C262T), and GPX1 (C593T) in 62 patients with acute PQ intoxication and the clinical outcomes of these patients.
Results
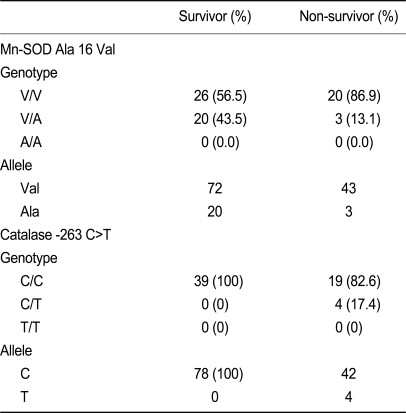
The frequency of the Mn-SOD V/V, V/A, and A/A genotypes were 56.3, 43.5, and 0% in survivors and 86.9, 13.1, and 0% in non-survivors (p > 0.05). The GPX1 C/C, C/T, and T/T genotypes were present in 100, 0, and 0% of all subjects. The catalase C/C, C/T, and T/T genotypes were present in 100, 0, and 0% of survivors, and in 82.6, 17.4, and 0% of non-survivors. Neither erythrocyte SOD activity nor catalase activity were significantly different between survivors and non-survivors.
Conclusions
No association was found between clinical outcome of acute PQ intoxication and the genetic polymorphism of GPX1 (C593T) or the genetic polymorphisms or enzyme activity of superoxide dismutase (V16A) or catalase (C262T).
INTRODUCTION
Paraquat (PQ) catalyzes the formation of reactive oxygen species (ROS). Within aerobically living cells, ROS are continuously produced to carry out biological reactions [1]. Overproduction, however, can damage cell membranes through the peroxidation of membrane polyunsaturated fatty acids. Ingestion of PQ results in subsequent redox cycling and the generation of ROS that can trigger lung injury due to preferential uptake and accumulation of PQ in the lungs [2]. PQ intoxication thus frequently causes death due to respiratory failure [3,4].
Plasma PQ concentration is an excellent prognostic indicator of patient outcome [5,6]. Nevertheless, many patients succumb to PQ at low concentrations, whereas others with similar PQ concentrations recover [7]. The activity of ROS is countered by intracellular antioxidant defenses provided by superoxide dismutase (SOD), catalase, and glutathione peroxidase/reductase [8]. Individual differences in antioxidant capacity could account for variable clinical outcomes. To date, however, there are no reported associations between total antioxidant levels in the serum and the clinical outcome of patients with acute PQ intoxication [9].
The relative importance of individual antioxidant capacity depends on the nature of the oxidant in question and the target molecule that must be protected from oxidative damage. Considering that ROS are formed mainly in cells that possess strong antioxidant enzymes, individual differences in the activity of these enzymes might be responsible for variable clinical outcome despite similar plasma PQ levels [10]. We investigated whether there was an association between clinical outcome and genetic polymorphisms of SOD (V16A) [11], catalase (C262T) [12], and glutathione peroxidase 1 (GPX1) (C593T) [13] as well as antioxidant enzyme activity in patients with acute PQ intoxication.
METHODS
Patient characteristics
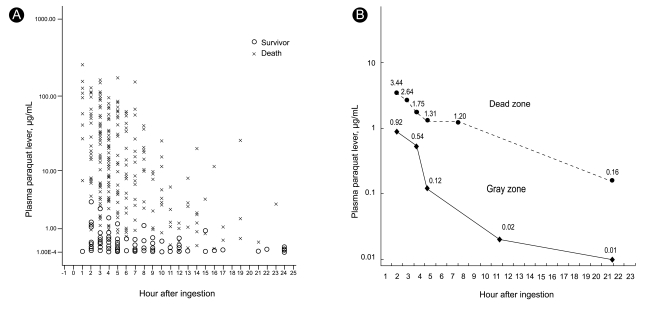
This study was approved by the Soonchunhyang Cheonan Hospital's Institutional Review Board and all procedures were performed after receiving informed consent. In 2008, we reported an association between plasma PQ levels and clinical outcome in 375 patients with acute PQ intoxication during 2006 and 2007 [8]. The upper limit of PQ levels among survivors was 3.44 g/mL at 2 hours, 2.64 g/mL at 3 hours, 1.75 g/mL at 4 hours, 1.31 g/mL at 5 hours, 1.2 g/mL at 8 hours, and 0.16 g/mL at 24 hours, whereas the lower limit among non-survivors was 0.92 g/mL at 2 hours, 0.54 g/mL at 4 hours, 0.12 g/mL at 5 hours, 0.02 g/mL at 12 hours, and 0.01 g/mL at 24 hours (Fig. 1A). These levels can be divided into a dead zone (above the upper line), gray zone (between the two lines), and a safe zone (below the low line; Fig. 1B). In the gray zone, some patients succumb while others with similar PQ levels recover. In 2008, 62 out of 320 cases with acute PQ intoxication could be categorized into the gray zone, retrospectively. In this study, we evaluated genetic polymorphisms in stored whole blood collected from these patients and measured catalase and SOD activity.

(A) The upper and lower limit of paraquat level among survivors and non-survivors in 375 patients with acute paraquat intoxication (x: non-survivors, o: survivors). (B) These levels can be divided into a dead zone (above the upper line), gray zone (between the two lines; may die or may live), and a safe zone (below the lower line).
All patients attempted suicide by PQ ingestion and were admitted to the Institute of Pesticide Poisoning, Soonchunhyang University Cheonan Hospital, from January through December 2008. The age, gender, clinical characteristics, and baseline laboratory findings are summarized in Table 1. Standard medical emergency procedures were provided for all patients. Briefly, gastric lavage was performed within 2 hours of PQ ingestion for all patients that immediately presented to the emergency room (ER). For those who had been intoxicated for up to 12 h before presenting to the ER, 100 g fuller's earth in 200 mL 20% mannitol was given. Hemoperfusion was performed on patients that had a positive urinary PQ test on arrival to the ER. The amount ingested was estimated based on the number of swallows, where one mouthful was considered 20 mL. High-resolution computer tomography (HRCT) was performed 7 days after ingestion, and a follow-up HRCT was performed 1 week later if any abnormality was detected. Survivors were defined as those patients who survived more than 3 months after PQ ingestion, maintained stable vital signs, had no evidence of progressive organ failure (especially the kidneys and lungs), and had no specific complaints.
Urinary PQ levels were measured semi-quantitatively by a dithionite method, and the plasma PQ levels were evaluated by HPLC. Malonyldialdehyde (MDA) was measured with an assay kit (NWLSSTM, Northwest Life Science Specialties LLC, Vancouver, Canada).
SOD assay
SOD activity in erythrocyte lysates was measured using a commercially available assay kit (Cayman Chemical Superoxide Dismutase Assay Kit, Ann Arbor, MI, USA). This kit uses tetrazolium salt to detect superoxide radicals generated by xanthine oxidase and hypoxanthine. One unit of SOD is defined as the amount of enzyme needed to exhibit 50% dismutation of a superoxide radical. This assay measures all three types of SOD (Cu/Zn-, Mn-, and Fe-SOD).
Catalase assay
Catalase activity in erythrocyte lysates was measured using a commercially available assay kit (Cayman Chemical Catalase Assay Kit). This kit uses the peroxidase function of catalase to determine enzyme activity. The method is based on the reaction of the enzyme with methanol in the presence of an optimal concentration of H2O2.
Genotyping
Genotyping was performed based on previously published reports [12-15]. Genomic DNA was extracted from peripheral white cells using the commercially available Chemagic DNA blood kit special (960 preparations from 200 µL blood) according to the manufacturer's instructions (Chemagen, Baesweiler, Germany) and amplified using the following primers: MnSOD 47T>C, 5'-ggctgtgctttctcgtcttc-3' and 5'-ccatcgaggcactccttcta-3'; Catalase -262C>T, 5'-ccaggattgctgacttttt-3' and 5'-tgtgcagaacactgcagga-3'; GPX1 c.593C>T, 5'-gggttctagctgcccttctc-3' and 5'-caggtgttcctccctcgtag-3'. Direct sequencing of the PCR products was performed on both forward and reverse strands using the same primers for PCR and cycle sequencing using v3.1 BigDye terminator sequencing kit on an ABI 313Oxl Genetic Analyzer (Applied Biosystems, Foster City, CA, USA).
Statistical analysis
Unless otherwise noted, the data are presented as the means ± standard deviation for continuous variables, and the frequency, in percent, for the categorical variables. Statistical analysis was performed with SPSS version 12.0 (SPSS Inc., Chicago, IL, USA), and all p values < 0.05 were considered statistically significant. The differences between groups were compared with the Student's t test for continuous variables, and the χ2 test or Fisher's exact test for categorical variables. The results of the logistic regression analysis are reported as odds ratios with 95% confidence interval (CI).
RESULTS
Table 1 summarizes the baseline characteristics of the patients, including age, gender, amount of PQ ingested, time lag after PQ ingestion to arrival in the ER, and initial laboratory findings. Among the 62 cases, 23 patients (37.1%) died. Table 2 summarizes the antioxidant activity in stored whole blood samples taken from these patients. Neither erythrocyte SOD nor catalase activity showed a difference between the survivors and non-survivors. Differences in initial laboratory parameters between survivors and non-survivors was also not noted, although the PQ level was higher in the non-survivor group than survivor group.
The Val allele of Mn-SOD and C allele of the catalase gene did not differ between survivors and non-survivors (Table 3). Non-survivors tended to have a higher frequency of the C/T catalase allele, which was not detected in survivors. The odds ratio of the Mn-SOD Val allele for non-survivors was 0.300 (95% CI, 0.075 to 1.197); that of the catalase C allele for non-survivors was 1.211 (95% CI, 1.004 to 1.460). All four patients with the C/T allele of catalase died, whereas only 32.78% patients with the T/T allele of catalase died. This suggests a high death rate in patients with the C/T allele of catalase, but the sample size was too small for statistical analysis and there was no statistical significance in multiple logistic regression analysis. The GPX1 c. C/C, C/T, and T/T genotypes were present in 100/0/0% of subjects.

Genotype distribution, allele frequency, and risk association with two polymorphisms in survivors and non-survivors
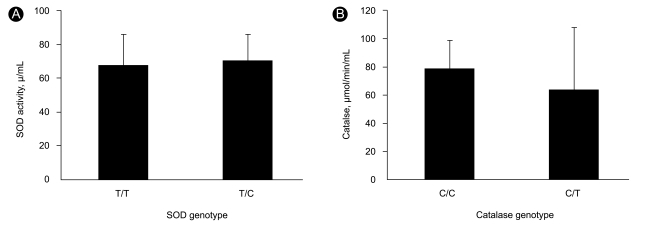
There were no significant differences in SOD enzyme activity between genetic polymorphisms (78.6 ± 20.6 U/mL for the T/T genotype and 70.5 ± 15.3 U/mL for the T/C genotype, p = 0.774, Mann-Whitney test) or in catalase enzyme activity between genetic polymorphisms (78.6 ± 20.6 µmol/min/mL for the C/C genotype and 70.5 ± 15.3 µmol/min/mL for the C/T genotype, p = 0.479, Mann-Whitney test) (Fig. 2).

Comparison of superoxide dismutase (SOD) and catalase activity according to genotype. (A) There were no significant differences in SOD activity between the T/T and T/C polymorphism (p = 0.774). (B) There were no significant difference in catalase activity between the C/C and C/T polymorphism (p = 0.479).
DISCUSSION
We have treated many patients with acute PQ intoxication and have noted that some die at relatively low PQ concentrations whereas others recover [7,16]. The present study was designed to determine whether individual differences in antioxidant capacity might be responsible for this variable clinical outcome. Contrary to our expectations, no significant differences were found in the distribution of the polymorphisms of MnSOD c.47T>C, Catalase -262C>T, or GPX1 c.593C>T between survivors and non-survivors. In addition, there was no significant differences in total SOD and catalase activity, and the functional polymorphisms of the Mn-SOD and catalase genes studied were not associated with changes in erythrocyte SOD and catalase activity. One explanation for this may be that Mn-SOD activity accounts for ~90% of total SOD activity and thus does not specifically measure total SOD activity. In addition, other polymorphisms (such as the SOD3 gene +760C>G substitution of arginine 213 with glycine) have been reported to be associated with differences in individual antioxidant capacity [17]. Thus, further studies are needed to study the functional polymorphisms of the two other isoforms of SOD.
The -262C>T polymorphism in the promoter region of the human catalase gene is associated with transcription factor binding and blood catalase levels [12]. Unfortunately, the homozygous T/T genotype is rare in Asia [18], occurring in none of the patients in the present population. In this setting, it is impossible to adequately assess the functional activity of the T/T genotype. However, there was no difference in catalase activity between survivors and non-survivors, regardless of genotype. One previous study reported significant racial differences in free radical-scavenging enzyme activity in children [18]. Unfortunately, the frequency of genetic polymorphisms was extremely low in both the catalase and GPX genes. Therefore, we could not perform statistical analysis to understand the association between these genetic polymorphisms and clinical outcome in patients with acute PQ intoxication.
One of the strengths of the present study is that the subjects were recruited from the "gray zone" in which some patients succumb and others with similar PQ levels recover. Indeed, plasma PQ concentration is an excellent prognostic indicator. No patients survived when the PQ level was in the dead zone and no patient died when the PQ level was in the safe zone. However, in the gray zone, some died and others survived. The results of this study do not explain the reason for the variable outcomes in the gray zone. There was no association between the genetic polymorphisms studied and clinical outcome. However, plasma PQ levels were significantly lower in survivors than in non-survivors, even in the gray zone.
Some limitations of this study should be noted. First, the sample size was small due to the limited number of patients in the gray zone, and there was no control group. However, all patients were healthy and similar to the general population until they attempted suicide. Second, measurements of antioxidant enzyme activity were based on erythrocytes only, which might not reflect the local levels in organs such as the lungs. Third, our study did not consider many other genetic polymorphisms that have been proposed as potential factors that could explain individual differences in antioxidant capacity. Fourth, individual differences in the capacity to reduce PQ to the mono-cation radical could potentially cause heterogeneous clinical outcomes because PQ must first be reduced to mediate ROS formation. Finally, measurements of SOD and catalase activity were performed at one random point in time, which does not reflect the possible variability in these parameters over time.
Enzymatic defense against ROS involves the cooperative action of several antioxidant enzymes. SOD is one of the key enzymes that reacts with O2•- to generate H2O2, which acts as a substrate for GPX and catalase to form H2O [19]. The results of studies on antioxidant enzyme activity have been controversial with regard to ROS-implicated diseases. The activities of SOD and catalase increase after smoking in human alveolar macrophages [20]. However, other studies on animal models with severe or chronic oxidant exposure have demonstrated that the induction of Mn-SOD is transient and that antioxidant enzymes may even be down-regulated [21]. Our results suggest that the clinical outcome of acute PQ intoxication is not influenced by individual differences in antioxidant capacity. Even if individual variation in antioxidant capacity does affect the clinical outcome of patients with so-called ROS-implicated diseases [22-26], PQ intoxication might overwhelm the system.
Notes
No potential conflict of interest relevant to this article was reported.

