Role of Nitric Oxide in the Pathogenesis of Diabetic Nephropathy in Streptozotocin-Induced Diabetic Rats
Article information
Abstract
Objectives
Several reports suggest that enhanced generation or actions of nitric oxide (NO) have been implicated in the pathogenesis of glomerular hyperfiltration and hyperperfusion that occurs in early diabetes. However, the precise role of altered NO generation in the pathogenesis of diabetic nephropathy is unclear. The present study was aimed at investigating the role of nitric oxide in the pathogenesis of glomerular hyperfiltration and hyperperfusion in streptozotocin-induced diabetic rats.
Methods
To evaluate the role of NO in diabetic hyperfiltration, we measured plasma and urine concentrations of NO2−/NO3−, stable metabolic products of NO and protein expressions of three isoforms of nitric oxide synthase (NOS) in streptozotocin-induced diabetic rats. We also investigated renal hemodynamic changes, such as glomerular filtration rate (GFR) and renal plasma flow (RPF), in responses to acute and chronic administration of NO synthesis inhibitor, nitro-L-arginine methyl ester (L-NAME), in diabetic and control rats.
Results
Diabetic rats exhibited significantly elevated plasma and urinary NO2−/NO3− levels at 28 days after streptozotocin injection, and total excretion of NO2−/NO3− was approximately five-fold higher in diabetic rats than controls. Insulin and L-NAME treatment prevented the increases in plasma and urinary NO2−/NO3− concentrations in diabetic rats, respectively. The three isoforms of NOS (bNOS, iNOS, and ecNOS) were all increased in the renal cortex, whereas they remained unaltered in the renal medulla at day 28. GFR and RPF were significantly elevated in diabetic rats, and acute and chronic inhibition of NO synthesis by L-NAME attenuated the renal hemodynamic changes (increases in GFR and RPF) in diabetic rats, respectively.
Conclusions
NO synthesis was increased due to enhanced NOS expression in diabetic rats, and chronic NO blockade attenuated renal hyperfiltration and hyperperfusion in diabetic rats. In addition, diabetic rats exhibited enhanced renal hemodynamic responses to acute NO inhibition and excreted increased urinary NO2−/NO3−. These results suggest that excessive NO production may contribute to renal hyperfiltration and hyperperfusion in early diabetes.
INTRODUCTION
Diabetic nephropathy is the leading cause of end-stage renal disease1). In addition, the development of diabetic nephropathy has a dramatic impact on the morbidity and mortality in diabetic patients2, 3). The early stages of both clinical and experimental diabetes mellitus are characterized by abnormal glomerular hemodynamics, such as glomerular hyperperfusion and hypertension, which result in glomerular hyperfiltration4–6). This glomerular hyperfiltration has been proposed as one of the important factors in the pathogenesis of diabetic nephropathy7, 8). Multiple agents or mediators for the hyperfiltration of early diabetes have been proposed9). Nitric oxide (NO) plays a critical role in the regulation of renal hemodynamics10, 11), and is likely to be involved in the development of glomerular hyperfiltration in diabetes mellitus12, 13). However, other studies14, 15) showed impaired nitric oxide release from diabetic kidneys and a role of nitric oxide in the pathogenesis of diabetic nephropathy has not been clear yet. The present study was aimed at investigating the role of nitric oxide in the pathogenesis of glomerular hyperfiltration in streptozotocin-induced diabetic rats. In the present study, we sought to investigate; (1) whether nitric oxide synthesis might be increased in the early stage of diabetic mellitus.; (2) nitric oxide might be one of the important mediators responsible for diabetic hyperfiltration.; (3) inhibition of excess nitric oxide synthesis by nitric oxide synthase (NOS) inhibitor might ameliorate or attenuate diabetic renal hyperfiltration.
MATERIALS AND METHODS
Male Sprague-Dawley rats, weighing 200 to 250 g, were used. Diabetes mellitus was induced by tail vein injection of streptozotocin (55 mg/kg body wt: Sigma Chemical Co., St. Louis, MO, USA). Body weight-matched control (normal) rats received a sham injection of the vehicle (0.9% NaCl). Blood glucose levels were measured with a blood glucometer (Lifescan Inc, Milpitas CA, USA) in the morning, 2 days and 28 days (during experiment) after streptozotocin injection, and the rats with blood glucose levels less than 300 mg/dL were excluded from the study. A group of diabetic rats was chronically treated daily in the afternoon with ultralente insulin (Iletin II, Eli Lilly, Indianapolis, IN, USA), with the dose (6–10 U) adjusted individually to normalize blood glucose concentration, 3 days after induction of diabetes. Another group of diabetic rats was treated with nitro-L-arginine methyl ester (L-NAME, Sigma), an inhibitor of NOS, dissolved in the drinking water at 10 mg/L, 3 days after streptozotocin injection. The animals were housed in individual cages, given free access to water and standard chow ad libitum.
Study design
As an index of synthesis of nitric oxide (NO), we measured plasma and urine concentrations of NO2−/NO3−, the stable metabolic products of NO, and protein expressions of 3 isoforms of nitric oxide synthases (NOS; bNOS, iNOS and ecNOS) in the kidney (Study I), and also performed renal hemodynamic studies (Study II).
Studies of nitric oxide synthesis (Study I)
To investigate whether nitric oxide synthesis alters in the early stage of diabetes mellitus, rats were divided into four groups and fed the same diet described previously. Group I (11 normal rats) and group 2 (14 diabetic rats) were given tap water. Group 3 (9 diabetic rats) was treated with insulin therapy, as described before. Group 4 (11 diabetic rats) was given tap water containing L-NAME. At day 28 following the streptozotocin injection, anesthesia was induced by i.p. injection of thiopental (50mg/kg body wt).
The urinary bladder was exposed through a small lower midline abdominal incision and the bladder was cannulated with PE 50 tubing for timed urine collection, and collected urine was stored at −20°C. After urine collection, the rats were sacrificed and trunk blood was collected and the obtained plasma was stored at −20°C. The kidneys were also taken, immediately frozen in liquid nitrogen and stored at −70°C until used for Western blot analysis.
NO2−/NO3− assays
The stable metabolic products of nitric oxide, NO2−/NO3−, were determined in deproteinated plasma and urine by the Griess reagent16). All samples were kept at −70°C until analysis. To a 500 μL sample was added 100 μL 35% sulfosalicylic acid, and this was reacted for 30 min at room temperature for deproteination.
For assay of nitrite and nitrate of samples, two hundreds μL samples containing 100 μL of 200 mM ammonium formate (including 100 mM HEPES, Sigma Chemical Co.) were reduced to nitrite at 37°C for one hour by adding 100 μL nitrate reductase [E coli (ATCC25922), American Type Collection, Rolville, Md], followed by centrifugation to precipitate nonreacting E. coli for five minutes, and then the nitrite was quantified. Nitrite production was quantified colorimetrically after the Griess reagent16) (0.1% naphphyl ethylene diamine dihydrochloride and 1% sulfanilamide in 5% concentrated phosphoric acid, Sigma Chemical Co.) in duplicate microtiter wells at room temperature. Chromophore absorbency at 540 nm was determined. Nitrite concentration was calculated using sodium nitrite (BDH Chemical Co.) as a standard.
Western blot analysis
The protein levels of 3 isoforms of NO synthases (bNOS, iNOS, and ecNOS) were determined by Western blot analysis in the kidneys of control and diabetic rats. The importance of post-transcription of ecNOS has been appreciated rather than transcriptional regulation17). Post-transcriptional regulation of iNOS also appears to be important18, 19). Therefore, we used Western blot analysis to assess the changes in NOS expression.
Whole protein extracts were prepared and Western blotting was analyzed according to the method of Mattson and Higgins, with a slight modification20). Protein samples (100 μg) were electrophoretically size-separated with a discontinuous system, consisting of a 6% polyacrylamide resolving gel and 5% polyacrylamide stacking gel, and transferred to a nitrocellulose membrane at 20 V and 100 mA overnight. The membranes were washed, blocked, incubated with a 1:2500 dilution of monoclonal mouse anti-NOS (Transduction Laboratories, Lexington, KY, USA), and then incubated with a horseradish peroxidase-labeled goat anti-mouse IgG (1:1000). The bound secondary antibody was detected by enhanced chemiluminescence (Amersham, Buckinghamshire, UK). The protein levels of the three isoforms of NOS were determined by analyzing the signals of Western blot autoradiograms using the transmitter scanning videodensitometer.
Renal hemodynamic studies (Study II)
We investigated the renal hemodynamic effects of acute and chronic inhibition of NO synthesis in streptozotocin-induced diabetic rats 28 days after streptozotocin (STZ) injection. We studied with 4 groups of experiment in 9 normal rats (group 1), 11 diabetic rats (group 2), 8 diabetic rats with insulin-treated (group 3) and 9 diabetic rats with chronic inhibition of NO synthesis with L-NAME (group 4). Anesthesia was induced by i.p. injection of sodium thiopental (50 mg/kg body wt). To determine the rate of urinary albumin excretion, the rats, treated as described above, were housed in individual metabolic cages at 27 days of diabetes. Urine was then collected during 24 h and albumin concentrations were measured by radioimmunoassay. The animals were prepared for renal hemodynamic studies at 28 days after streptozotocin injection. Animals were anesthetized with an intraperitoneal injection of sodium thiopental (50 mg/kg body wt). Polyethylene catheters (PE-50) filled with normal salines were inserted in the left jugular vein and the left carotid artery. After vessel cannulation, the left kidney was exposed through a small midline abdominal incision, extended laterally, and then a PE-50 polyethylene tubing was inserted into the left ureter. A continuous infusion of [3H] inulin (4 μCi·h−1·kg body wt−1; Amersham, Bucks, U.K.) and 125I-labelled hippurate (4 μCi·h−1·kg body wt−1; Amersham), diluted in normal saline, was instituted via a jugular vein catheter at a rate of 1 ml/h. After 120 min of equilibration, two 20-to-30 min control periods were performed. Urine was collected throughout the periods via a left ureter catheter connected to preweighed 5-ml plastic tubes, and the volume was measured gravimetrically. Blood samples (300 μL) were taken from the arterial catheter at the midpoint of each period, and blood loss was replaced with an equivalent volume of normal saline. We also evaluated the effects of acute inhibition of nitric oxide synthesis by L-NAME on the renal hemodynamics in control and diabetic rats. Control (baseline) measurements were conducted as described previously. After completion of control periods, to determine to what extent diabetes related glomerular hyperfiltration is caused by enhanced NO synthesis, 9 control and 11 diabetic rats were infused with NO synthesis inhibitor, L-NAME (Sigma). If the elevated GFR in diabetic rats is caused by an increased NO synthesis, L-NAME should normalize or decrease the GFR between control and diabetic rats.
After the collection of baseline clearances, L-NAME was infused at 50 μg/kg body wt per min for 60 min, and three additional 20-min clearances were then collected. Blood samples (approximately 100 μL) were collected after the first baseline clearance and at the end of the study (approximately 50 μL). Glomerular filtration rate (GFR) of the left kidney was calculated from the expression GFR = U/Pinulin × V where U/Pinulin is the urine/plasma [3H]-inulin concentration ratio, and V is the urine flow rate in ml/min. The concentrations of 125I-hippurate were determined, as described below, and the extraction factor was calculated as 1 – (Cv/Ca), where Cv and Ca are the iodohippurate concentrations in renal vein and renal artery, respectively. Using this method, the extraction factor in the control rats was 0.86 ± 0.03 and 0.89 ± 0.05 in the diabetic rats (p>0.05). These extraction factors were subsequently used for calculations of renal plasma flow (RPF). Plasma and urine [3H] inulin concentrations were determined by β-counting of 10 μL aliquots for 5 min(LS 6500, Beckman, Fullerton, CA USA), and concentrations of 125I-hippurate were determined in 75 μL samples counted for 5 min by γ-counter (Cobra, Auto-Gamma 5005, Packard, Meriden, CT, USA). Beta activity of 125I was subtracted from 3H counts. RPF was determined as the quotient of hippurate clearance and the extraction factor. Filtration fraction (FF) was calculated as the quotient of GFR and RPF.
Statistical Analysis
Data are expressed as mean ± SEM. The significance of the difference was analyzed by the Student’s t test of unpaired data. P values < 0.05 were considered significant.
RESULTS
Effects of diabetes mellitus on nitric oxide synthesis (Study I)
Body weight and blood glucose levels are shown in Table 1. There was no significant difference in body weight between the groups of rats at the time of the study. However, diabetic rats exhibited severe hyperglycemia. The blood glucose levels in the diabetic rats with insulin treatment were significantly lower compared with those in diabetic rats without insulin treatment (p<0.001), but still higher compared with those in control rats (p<0.05). However, L-NAME did not affect the blood glucose levels in diabetic rats.

Blood Glucose Levels and Body Weight
Plasma NO2−/NO3− levels were significantly higher in streptozotocin-induced diabetic rats at day 28 than in control rats (p<0.05). However, plasma NO2−/NO3− levels in insulin-treated diabetic rats were not different from those in diabetes without insulin treatment. In addition, plasma NO2−/NO3− levels in diabetic rats with L-NAME treatment were not different from those in controls (Fig. 1). The higher plasma levels of NO2−/NO3− and the higher GFR, filtered NO2−/NO3−, were twice more higher in the diabetic rats. Diabetic rats exhibited significantly elevated urinary NO2−/NO3− levels at 28 days of diabetes, when compared with control rats (p<0.001), and the total excretion of NO metabolites (NO2−/NO3−) was approximately five-fold higher in diabetic rats than controls. Insulin and L-NAME therapy prevented the increment of the urinary levels of NO2−/NO3− in diabetic rats, respectively, as shown Fig. 2.
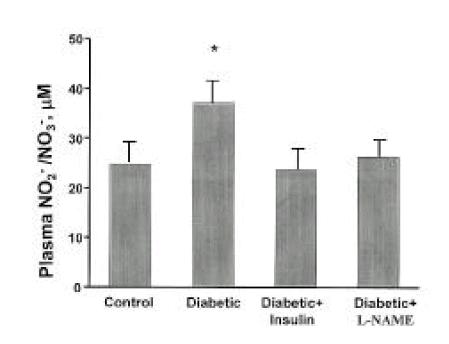
Plasma levels of NO2−/NO3− are shown at 28 days of diabetes as μM for each rat group. Data are shown mean ± SEM. *p<0.05 vs. control.
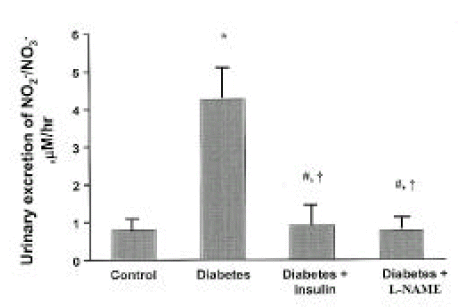
Urinary excretion of NO2−/NO3− are shown at 28 days of diabetes as μM/hr for each rat group. Data are shown as mean ± SEM. *p<0.001 vs. control; #p>0.05 vs. control; †p<0.001 vs. diabetes.
Three isoforms of NOS (bNOS, ecNOS, and iNOS) were determined in the renal cortex, and outer and inner medullas of control and diabetic rats by Western blot analysis. Anti-bNOS, anti-ecNOS and anti-iNOS anti-bodies recognized protein bands with molecular sizes of 155, 140 and 130 kDa, respectively. The three isoforms were all increased in the cortex, whereas they remained unaltered in the medulla at day 28 (Fig. 3 and 4).
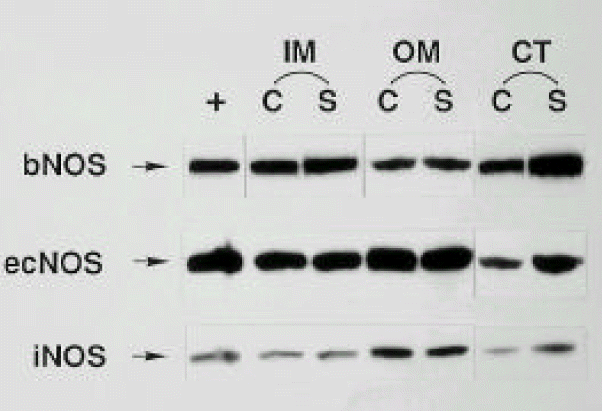
Western blots probed with anti-bNOS, anti-ecNOS and anti-iNOS monoclonal antibodies in the inner medulla (IM), outer medulla (OM) and cortex (CT) isolated from control (C) and STZ-induced diabetic (S) rats.
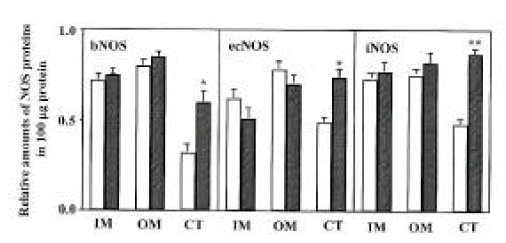
Densitometric analysis of bNOS, ecNOS and iNOS in inner medulla (IM), outer medulla (OM) and cortex (CT) of the kidney. Open bars indicate control and hatched bars indicate diabetes. Each point represents mean ± SEM from 8 experiments. *p<0.05, compared with control; **p<0.001, compared with control.
Renal hemodynamic studies (Study II)
Diabetic rats exhibited severe hyperglycemia (549±81 mg/dL ; control, 96±11 mg/dL; p<0.001). Insulin treatment significantly decreased the blood glucose levels, but did not normalize them to control levels (174±36 mg/dL; control, 96±11 mg/dL; p<0.05). L-NAME therapy did not affect the blood glucose levels (503±97 mg/dL; diabetic, control, 549±81 mg/dL; p>0.05).
Table 2 shows the effects of diabetes mellitus, insulin-treated diabetes mellitus and chronic inhibition of NO synthesis by L-NAME in diabetes on the renal hemodynamics at 28 days of diabetes. GFR and RPF were significantly elevated in the diabetic rats compared with control rats (p<0.01, p<0.001, respectively). However, filtration fraction (FF) between the groups did not have statistically significant difference. There were no significant differences in renal hemodynamic parameters, such as GFR, RPF and FF, between the insulin-treated diabetic and normal rats. GFR and RPF in diabetic rats with L-NAME treatment were significantly lower than those in the diabetic rats were (p<0.05, respectively), but still higher than those in the normal rats (p<0.05, p<0.01, respectively).

Renal Hemodynamics in Left Kidney
In the next series of experiments, we examined the effects of acute inhibition of nitric oxide synthesis by L-NAME administration at day 28 on the renal hemodynamics in rats of the control and diabetes mellitus groups (Table 3). The mean arterial pressure rose significantly after acute L-NAME administration in both control and diabetic rats (p<0.05, respectively). The GFR remained stable after acute L-NAME treatment in normal rats. In contrast, the GFR of diabetic rats fell significantly after acute L-NAME infusion, compared with that of baseline (p<0.05), but was still higher, compared with that of control rats (p<0.05). Likewise, acute L-NAME treatment did not affect significantly the RPF in normal rats, but decreased the RPF in diabetic rats (p<0.05). However, the RPF in diabetic rats was still higher than that in normal rats (p<0.01).

Acute Effects of L-NAME Infusion on Renal Hemodynamics in the Left Kidney at 28 Days of Diabetes
Fig. 5 shows urinary albumin excretion rate for 24 h at day 28 of diabetes. Diabetic rats had increased urinary albumin excretion as compared with normal rats (p<0.01). Insulin treatment in diabetic rats effectively prevented the increased urinary albumin excretion. L-NAME treatment in diabetic rats significantly retarded the increased urinary albumin excretion at day 28 of diabetes (p<0.05), but could not return it to the levels of normal rats (p<0.05).

Urinary albumin excretions are shown at 28 days of diabetes. Data are expressed as mean ± SEM. *p<0.05 vs. control; **p<0.01 vs. control; † p<0.05 vs. diabetes.
DISCUSSION
The present study shows that plasma and urinary excretion levels of NO2−/NO3− are significantly higher in diabetic rats of 28 days duration than in normal rats. Since NO2−/NO3− is the stable oxidation product of NO, which has a very short half-life, NO2−/NO3− can be taken as an index of NO production. Furthermore, measurement of urinary excretion of NO2−/NO3− provides a marker for assessment of the renal NO production26). It is reasonable to assume that the higher blood levels are the result of a generalized increase in synthesis of NO throughout the body. The blood samples for these measurements were collected from the trunk and, therefore, the central circulation, although regional differences in various organs may exist. Because of the higher blood levels and the higher GFR in the diabetic rats, the filtered load of NO2−/NO3− was approximately two-fold greater in the diabetic rats than in the normal rats and urinary excretion was about five-fold greater. The kidney is therefore a major organ for excretion of NO2−/NO3− in both normal and diabetic rats. These results agree with other studies12, 13). Blood glucose levels in insulin-treated diabetic rats were significantly lower than those in diabetic rats without insulin therapy, but still higher than those in normal rats. Insulin therapy effectively prevented the increment of the blood and urinary excretion levels of NO2−/NO3− in diabetic rats, although blood glucose levels reduced markedly, but were still higher than normal levels. L-NAME, nonspecific inhibitor of nitric oxide synthase, also completely prevented the diabetes-related increases in blood and urinary NO2−/NO3− levels in diabetic rats.
In the current study, NO synthesis was increased in diabetes, and insulin or L-NAME effectively prevented the enhanced NO synthesis in diabetes, respectively. These results are similar to the other studies21, 22). In contrast, a number of studies23–27) have shown that vascular relaxation in response to agents which release NO is impaired in diabetic animals and humans, and it has been postulated that diabetes interferes with synthesis or release of NO by endothelial cells. In addition, previous studies demonstrated an impairment of NO generation and/or stability in glomeruli from diabetic rats14), and attenuated glomerular cGMP production and renal vasodilation in diabetic rats15). The precise findings of altered NO synthesis or action in diabetes is uncertain and may differ depending on duration and severity of diabetes. Several lines of evidence suggest that NO generation and action may be increased early in diabetes28, 29). Our data support this possibility. By contrast, stability and action of NO may progressively decline later in diabetes, due to increases in the production of reactive oxygen species, oxidized LDL and advanced glycosylation endproducts combined with impaired antioxidant defense systems30–38). Thus, both a reduction in NO action and an increase in toxic products of NO such as peroxynitrite may contribute to diabetic glomerular injury in later stage39). The mechanisms whereby diabetes mellitus may argument NO production are unclear. Excessive NO biosynthesis could result from either the increased availability of its precursor, L-arginine, or the enhanced activity of NOS. Diabetic rats usually intake much more food, which may contain L-arginine. NO has been identified as a mediator of protein-induced hyperfiltration40–42). We did not examine the L-arginine concentrations in plasma and tissues, and so can not exclude the possibility of the increased availability of NO precursor, L-arginine, due to increase in food intake or altered amino acids metabolism in diabetes.
Our studies showed increases in nitric oxide synthase by Western blot analysis. In these studies, the three isoforms of NOS (bNOS, iNOS, and ecNOS) proteins were all increased in the renal cortex, whereas they remained unaltered in the renal medulla at day 28 of diabetes. Whether NOS proteins expression is altered, and, furthermore, what kind of isoforms of NOS proteins in diabetic rats is altered, is not clear yet. No changes43) or increases44, 45) in iNOS protein were detected in diabetes. Recent study44) suggests that glycated albumin modulates endothelial cell iNOS activity by stimulating TNF-α synthesis. NO changes46) or decreases45), or increases12) in ecNOS activity or expression, were also reported in diabetes. Our data support that NO production is increased in early diabetes and increased NO production is due to increases in all isoforms of NOS.
In the present studies, GFR and RPF were significantly increased in diabetes compared with controls. However, filtration fraction between the groups did not have significant difference. Insulin treatment effectively prevented the glomerular hyperfiltration and hyperperfusion in early diabetes, and chronic inhibition of NO synthesis by L-NAME did not completely prevent the altered renal hemodynamics, including increases in GFR and RPF, but attenuated the diabetic hyperfiltration and hyperperfusion. The mediators of glomerular hyperperfusion and hyperfiltration in early diabetes have not been confirmed yet9), but mediators, such as growth hormone47) and insulin-like growth factors48, 49), glucagon50), atrial natriuretic peptide51, 52), kinins53) and glucose itself54), have been proposed. Nitric oxide is one of the important vasodilators in vasculature and, furthermore, in the kidney participates in several vital processes, including the regulating glomerular and medullar hemodynamics, the tubuloglomerular feedback response, renin release and the extracellular fluid volume10, 11).
Recent studies12, 13) proposed that NO is a mediator of diabetic hyperfiltration and hyperperfusion. In our studies, the renal hemodynamic responses of diabetic rats to NO inhibitor are consistent with the hypothesis that excessive NO production participates in the pathogenesis of diabetic hyperfiltration and hyperperfusion. Acute administration of L-NAME partially reversed hyperfiltration and hyperperfusion in previously untreated diabetic rats, as opposed to unaltered GFR and RPF in controls. These enhanced responses support that excessive NO production may participate in the glomerular hyperfiltration and hyperperfusion in early diabetes. Data obtained in rats with chronic NO inhibition were consistent with those from acute experiments, since diabetic hyperfiltration and hyperperfusion were partially prevented by L-NAME treated, suggesting that NO participates in diabetic hyperfiltration and hyperperfusion. Chronic NO inhibition did not completely prevent glomerular hyperfiltration and hyperperfusion, rather attenuated them in diabetic rats. These results suggest that NO is one of the important mediators in altered hemodynamic changes in diabetes, and other mediators may participate in diabetic hyperfiltration and hyperperfusion. Our results are consistent with other studies12, 13, 22).
There is general agreement that the macula densa is the principal site of bNOS gene expression in the kidney55, 56). While both tubuloglomerular feedback (TGF) and myogenic mechanisms contribute to autoregulation, the TGF mechanism is essential for the highly efficient autoregulation that is characteristic of the renal circulation57). Most if not all autoregulatory responsiveness is vested in preglomerular arterioles. NO exerts vasodilating influences on both afferent and efferent arterioles10, 11, 58, 59), although the effects on the afferent arteriole appear to predominate60), and neuronal NO may have a unique role in counteracting TGF-mediated afferent arteriolar constriction57, 61–63). Tilton et al29) suggested that elevated glucose induces increases in intracellular levels of diacylglycerol, leading to activation of protein kinase C, which has been shown to activate NOS. Our studies demonstrated the increased expression of bNOS proteins, as well as ecNOS and iNOS proteins. Therefore, these results suggest that increased NO synthesis, due to increases in three isoforms of NOS, may participate in the pathogenesis of diabetic hyperfiltration and hyperperfusion. Lastly, our studies showed that chronic NO inhibition with L-NAME attenuated the urinary albumin excretion compared with diabetic rats, associated with attenuated hyperfiltration and hyperperfusion.
In summary, NO synthesis is increased due to enhanced NOS expression in diabetic rats and chronic NO blockade attenuated hyperfiltration and hyperperfusion in experiments of diabetes mellitus. In addition, diabetic rats exhibited enhanced renal hemodynamic responses to acute NO inhibition and excreted increased urinary NO2−/NO3−. These results suggest that excessive NO production may contribute to renal hyperfiltration and hyperperfusion in early diabetes.
Acknowledgments
This work was supported by the Chong-Ram grant from Korean Association of Internal Medicine