Role of Hyperinsulinemia and Glucose Intolerance in the Pathogenesis of Nonalcoholic Fatty Liver in Patients with Normal Body Weight
Article information
Abstract
Objectives
The pathogenesis of nonalcoholic fatty liver in non-obese persons is poorly understood. We aimed to elucidate whether hyperinsulinemia and glucose intolerance are associated with development of fatty liver in patients with normal body weight
Methods
Forty-seven patients with fatty liver were divided into non-obese (n=25) and obese groups (n=22) according to age adjusted body mass index. Inclusion criteria were as follows: (1) elevated transaminase levels during more than 3 months of follow up period, (2) no detectable HBsAg or anti-HCV in the serum, (3) alcohol consumption less than 40 gm/week, (4) no use of potential hepatotoxic drugs within 3 months and (4) sonographic evidence of fatty liver(moderate to severe degree). Baseline insulin levels and oral glucose tolerance test using 75gm of glucose were performed and the results were compared in each group of patients.
Results
Mean baseline insulin levels were elevated in both groups above the reference value, 9.3±3.5 μU/L in non-obese group and 9.9±3.5 μU/L in obese group (p=0.26). Seventeen of non-obese patients (68%) had elevated basal insulin level and 16 of obese patients (73%) had elevated basal insulin level (p=0.39). In oral glucose tolerance test, there was no difference in glucose level between non-obese and obese groups from O minute to 180 minutes (p > 0.05). Eleven patients from the non-obese group (44%) and 8 patients from the obese group (36%) had either impaired glucose tolerance or diabetes (p=0.29).
Conclusion
Our data suggest that hyperinsulinemia and glucose intolerance may play a role in the pathogenesis of fatty liver in patients with normal body weight as well as in patients with obesity.
INTRODUCTION
It is well known that large-droplet fatty change (steatosis) of the liver is common in asymptomatic obese persons: fatty infiltration (fatty liver, fatty hepatitis and fatty cirrhosis) of the liver is reported to develop in up to 90% of them1). Although it is unclear, there have been many proposed mechanisms of fatty liver. One of the proposed mechanisms is that hyperinsulinemia, which reflects insulin resistance in obese persons, is associated with development of fatty liver in obesity2). This hypothesis is based on the observation that steatosis and steatohepatitis occur in subcapsular liver of type I diabetic patients treated with intraperitoneal insulin delivery3). In a recent report, risk factor analysis in a large scale autopsy study indicates that obesity, non-insulin dependent diabetes and intravenous glucose therapy are associated with severe steatosis and steatohepatitis, which suggest the possibility that hyperinsulinemia may have a role in the pathogenesis of fatty liver4). It is believed that relative insulin secretion in patients with hyperinsulinemia and insulin resistance may eventually decrease and impaired glucose tolerance (IGT) and diabetes may occur, which also predispose the development of fatty liver5).
Some non-obese persons may also develop fatty liver or fatty hepatitis even though the incidence is not as high as in obese persons4,6). However, there is no report regarding the pathogenesis of fatty liver in non-obese persons. We assumed the fact that some non-obese persons can also develop insulin resistance leading to hyperinsulinemia, and glucose intolerance7) may have an association with the development of fatty liver in non-obese persons. In this study, we aimed to elucidate whether hyperinsulinemia, and glucose intolerance, as consequences of insulin resistance, are associated with the development of fatty liver in patients with normal body weight.
MATERIALS AND METHODS
1. Patients
From March 1996 to September 1996, 47 patients with fatty liver (25 non-obese, 22 obese) who visited the Samsung Medical Center were enrolled in the study. Obesity was defined when the body mass index (BMI was 25 kg/m2 or more in patients aged 19 to 24 years old and adding 1 kg/m2 as the age increases by 10 years8). Inclusion criteria were as follows: elevated transaminase levels during more than 3 months of follow-up period, absence of HBsAg by radioimmunoassay (AusriaR, Abbot Laboratories, USA) or anti-HCV by third generation enzyme-linked immunosorbent assay (Lucky HCDR 3.0, Lucky Pharmaceutical Div., Korea) in the serum, alcohol consumption less than 40 gm/week, no use of potential hepatotoxic drugs within 3 months prior to visit, and moderate to severe fatty infiltration of the liver by ultrasonography according to the Soatarige’s criteria9).
2. Laboratory Evaluation
Liver function tests and serum lipid profiles were checked in all patients included in the study. Baseline fasting insulin levels were measured by radioimmunoasay (RiabeadR II, Abbot Laboratories, Japan, reference value, 3–7 μU/L, by 98% confidence range). Oral glucose tolerance test was done with 75 gm of glucose. Interpretation of oral glucose tolerance test was done according to the revised criteria of National Diabetes Group of National Institute of Health10). Student’s t test was used for comparison of the means and chi-square test or Fisher’s exact test was used for comparison of the discrete variables where appropriate.
RESULTS
1. Demographics of patients
The mean age of the non-obese group was 45.7 years (range, 31–60 years) and 19 of 25 individuals were male. The mean age of the obese group was 40.8 years (range, 20–55 years) and 17 of 22 individuals were male. There was a difference of 10.1 Kg in mean body weight, but there was no significant difference in mean height between the two groups. The mean body mass indices were 24.9±1.6 kg/m2 in the non-obese group and 28.9±2.0 kg/m2 in the obese group (Table 1).
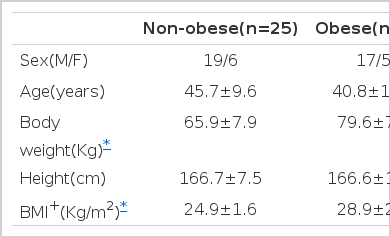
Characteristics of Patients.
2. Liver function test and lipid profiles
There was no difference in alkaline phosphatase (ALP), aspartate aminotransferase (AST), alanine aminotransferase, gamma-glutamyl transferase (γ-GT) levels between the two groups. Although there was a trend toward increased levels of triglyceride in the obese group, there was no statistical difference in lipid profile between the two groups (Table 2).
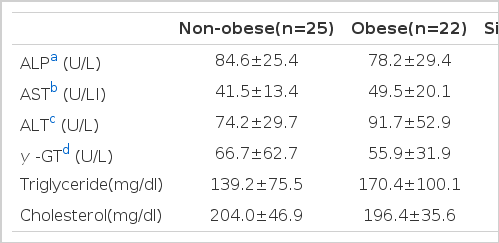
Liver Function tests and lipid Profiles
3. Baseline insulin levels
Mean baseline insulin levels were elevated above the reference value in both groups, 9.3±3.5 U/L in the non-obese group and 9.9±3.5 μU/L in the obese group (Fig. 1), with no statistical difference (p= 0.26). Seventeen of the non-obese patients (68%) and 16 of the obese patients (73%) had elevated basal insulin level: there was no statistical difference (p=0.39) in the proportion of patients with high insulin level between the two groups (Table 3).

Distribution of basal insulin levels. Mean basal insulin levels (dashed lines) were elevated in both groups.
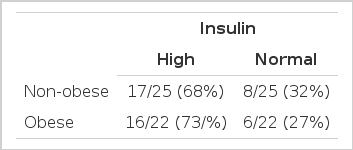
Proportions of Patients with high Insulin level
4. Oral glucose tolerance test
There was no difference in glucose levels between non-obese and obese groups from 0 minute to 180 minutes (Fig. 2). Eleven patients (7 IGT, 4 diabetes, 44%) from the non-obese group and 8 patients (4 IGT, 4 diabetes, 36%) from the obese group had either IGT or diabetes. There was no difference in the frequency of abnormal glucose tolerance test (p=0.29) between the two groups (Table 4).
Result of oral glucose tolerance test. There was no difference in glucose level between non-obese and obese group from 0 to 180 min(p>0.05).

Frequency of Impaired Glucose Tolerance or Diabetes.
Cross chi-square test was performed to see the relationship between the hyperinsulinemia and glucose intolerance, which showed that insulin level and glucose intolerance did not mutually affect each other (Table 5). Overall, 20 out of 25 non-obese patients (80.0%) and 18 out of 22 obese patients (81.8%) with fatty liver had either hyperinsulinemia, glucose intolerance, or both.
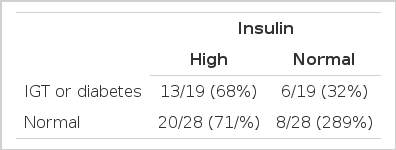
Relationship between Basal Insulin level and oral Glucose Tolerance test.
DISCUSSION
Although understanding of the mechanism causing fatty liver and its consequence is lacking at this point, a unifying hypothesis that might explain hepatic triglyceride accumulation is now possible based on our knowledge of fatty acid and triglyceride metabolism11). Fat continuously cycles between peripheral stores and the liver, and any relatively minor perturbation in this process can substantially alter the dynamic equilibrium established under normal conditions11). It is now apparent that the accumulation of fat in the liver can be attributed to aberration in at least one of the four basic processes as fat is cycled between hepatocyte and adipose tissue:11,12) (1) increased fatty acid delivery to the liver, (2) increased free fatty acid synthesis within the liver, (3) decreased β oxidation of fatty acids and (4) decreased very low density lipoprotein synthesis or secretion.
One of the possible contributing factors that can alter the fat equilibrium is insulin: insulin inhibits β oxidation of fatty acid13) and this effect might lead to increased cellular level of toxic free fatty acid which in turn causes hepatocyte injury. Obesity is one of the most common causes of insulin resistance and up to 85% of obese persons without overt diabetes (> 30% of ideal body weight) are known to have high insulin level to overcome insulin resistance7). From these facts, hyperinsulinerma is generally accepted as a causative factor associated with development of fatty liver in obesity.
Hyperinsulinemia and glucose intolerance, although not as frequent as in obese persons, has also been known to develop in some non-obese subjects14) which can possibly explain the development of fatty liver in these subjects. We were able to prove our hypothesis that hyperinsulinemia may be associated with development of fatty liver in non-obese subjects, because both mean basal insulin level and the frequency of hyperinsulinemia in non-obese subjects were similar to obese subjects.
In Korea, prevalence of impaired glucose tolerance and diabetes in the general population over the age of 30 is reported to be 8% and 12 %, respectively15). We had about a two-fold higher rate of impaired glucose tolerance or diabetes (44% in non-obese group, 36% in obese group) in patients who did not have elevated fasting serum glucose level, suggesting the role of glucose intolerance in the pathogenesis of fatty liver in patients without documented diabetes. Since there are reported cases of fatty liver or fatty hepatitis preceding the onset of overt diabetes16), early detection of IGT and diabetes without fasting hyperglycemia in patients with fatty liver can have important clinical meaning in terms of patient management. Our data regarding the high prevalence of glucose intolerance among fatty liver patients might justify routine application of glucose tolerance test in the evaluation of the patients with fatty liver, since results of abnormal glucose tolerance test warrant more strict management, such as control of body weight, exercise etc.
Ultrasonography is reported to have about 60% sensitivity in diagnosis of fatty liver17), but is reported to have up to 97% accuracy correlated to liver biopsy18). Although clinical utility of sonographic diagnosis of fatty liver in alcoholics is known to have limited clinical value, since cirrhosis can coexist with fatty liver, sonographic detection of fatty liver in nonalcoholic patients is reported to provide relevant clinical information that explain abnormal liver function tests19). In this study, diagnosis of fatty liver was made by ultrasonography and clinical and laboratory exclusion of alcoholic liver disease, viral hepatitis and drug induced liver injury. One of the pitfalls in our diagnosis could be that we might have missed some mild cases of fatty liver which are not detected by ultrasonography due to low sensitivity. Although ultrasonography has some limitations in distinguishing fatty liver from cirrhosis9), none of our patients showed stigmata of chronic liver disease or laboratory abnormalities that suggest cirrhosis, and it is very unlikely that these patients had cirrhosis. However, accurate quantitation of fatty infiltration was not possible without liver biopsy and correlation of fatty infiltration and degree of hyperinsulinemia could not be performed, which could be one of the limitations of our study. Another limitation of diagnosing fatty liver with ultrasonography is that differentiation of simple fatty liver and nonalcoholic steatohepatitis and/or fibrosis was not possible. Our cases might have included a significant number of nonalcoholic steatohepatitis cases since 15–30% of obese and person,1,2,4) and a few non-obese persons6,20) are reported to have non-alcoholic steatohepatitis. Since nonalcoholic steatohepatitis is reported to progress to liver cirrhosis6, 20) whereas simple fatty liver usually has favorable prognosis2), differentiation of the two would have put more clinical implication to our data. This study can be considered as a preliminary study to upcoming studies that include liver biopsies and more sophisticated methods that measures insulin resistance, overcoming the limitations of this study.
Our data suggest that a large percentage of patients with fatty liver have abnormalities in glucose metabolism, such as hyperinsulinemia and glucose intolerance, irrespective of obesity. In conclusion, we suggest that hyperinsulinemia and glucose intolerance may play a role in the pathogenesis of fatty liver in patients with normal body weight as well as in patients with obesity.
Notes
This research was supported by the research fund of Sung Kyun Kwan University College of Medicine