A population-based observational study of patients with pulmonary disorders in intensive care unit
Article information
Abstract
Background/Aims
Only a few epidemiologic studies on the patients with pulmonary disorders admitted to intensive care unit exist. We investigated the characteristics and clinical outcomes of the patients with severe pulmonary disorders.
Methods
The sample cohort database of National Health Insurance Sharing Service from 2006 to 2015 was used. Operational definition of critically ill patients was adults who were either admitted to intensive care unit for at least 3 days or expired within first 2 days in the unit. The pulmonary disorder group comprised of critically ill patients with respiratory disease as the main diagnosis.
Results
Among the 997,173 patients, 12,983 (1.3%) in 383 intensive care units were categorized as critically ill. Patients in the pulmonary disorder group tended to have more comorbidities or disabilities. The length of hospital stay and duration of mechanical ventilation were longer in the pulmonary disorder group. Overall mortality and re-admission were higher in the pulmonary disorder group, with adjusted incidence rate ratios of 1.22 (95% confidence interval, 1.18 to 1.27) and 1.26 (95% confidence interval, 1.17 to 1.36), respectively. After adjustment by Cox regression, the pulmonary disorder group was an independent risk factor for in-hospital mortality.
Conclusions
In critically ill patients with pulmonary disorder, the use of healthcare resources was higher, and their clinical outcomes were significantly worse than the non-pulmonary disorder group.
INTRODUCTION
The needs and expenditures for intensive care unit (ICU) in critically ill patients have been increasing, and the global burden of critical illness is more manifest as the aging population increases [1-3]. One of the major indications for admission to ICU is respiratory failure, which has a high mortality rate and increases economic and clinical burdens [4-7]. Although respiratory diseases account for a significant portion of respiratory failure [4,7], epidemiologic data on pulmonary disorders, especially in critical care medicine, is relatively insufficient.
Critically ill patients with respiratory problems are presumed to be at high risk for poor clinical prognosis in ICU, and more medical attention or resources should be directed toward them. Acute respiratory distress syndrome (ARDS) is detected in approximately 10% to 60% of the patients with mechanical ventilation (MV), with a mortality rate of approximately 40%, which exerts a large disease burden on ICU resources [8-10]. Admission to an ICU for respiratory failure in patients with chronic airway diseases, such as asthma, bronchiectasis, and chronic obstructive pulmonary disease, is a clinical burden on physicians as an independent risk factor for long-term admission and in-hospital mortality [11-13]. Nevertheless, the extent of burden due to pulmonary disorder on clinicians managing patients in ICU is not known. Therefore, the present study was conducted to address the necessity of a long-term epidemiologic study that determines the socio-demographic information, amount of medical services used, and prognosis of critically ill patients with pulmonary disorder.
METHODS
Study design, setting, and data sources
We referred to the strengthening the reporting of observational studies in epidemiology guidelines for drafting the study protocol and reporting the results of our study [14]. The present observational cohort study was designed retrospectively using the National Sample Cohort (NSC) database (version 2.0) developed by the National Health Insurance Sharing Service. The National Health Insurance Program has comprehensively covered the medical insurance and delivery system for the entire population of South Korea. The NSC database includes socio-demographic, clinical, and procedural information on 1,025,340 participants, which constitute 2.2% of the total population who claimed hospital charges, and represents the patients in South Korea from 2002 to 2015 by systematic stratified random sampling with proportional allocation to ensure representativeness [15]. The NSC database consists of the following six tables: (1) qualifications, (2) birth and death, (3) specifications, (4) medical history, (5) diagnosis, and (6) prescription history. As the NSC database includes those who were alive in 2006, we analyzed 997,173 patients who were followed up from 2006 to 2015. An event of ICU admission was identified by special codes in the claim database, which were considered highly accurate because these exclusive codes were made differently from other codes, and every medical institute must enter these codes to claim medical expenses from the National Health Insurance Review & Assessment Service (Supplementary Table 1). Procedures conducted only for critical care, such as MV, endobronchial tube management, and continuous renal replacement management, were identified using the same method. We analyzed the data using the Korean Standard Classification of Diseases and Causes of Death 7th revision (KCD-7) code, which is based on the International Statistical Classification of Diseases and Related Health Problems 10th revision, to reveal the most reliable diagnosis for ICU admission and mortality.
Participants
We identified all the patients with at least one or more events of ICU admission between January 1st, 2006 and December 31st, 2015. During this period, the subspecialty certification for critical care was started (in 2008), and a major epidemiological event, the 2009 influenza A virus subtype H1N1 pandemic, occurred, with a high ICU mortality of 42.6% [16]. There was no other considerable change in the nationwide policies for ICU admissions, management, and discharges. As our target population was critically ill patients in ICUs, we excluded the patients who were admitted to ICUs without critical illnesses, such as for close observation after procedure or surgery and only for short term intermediate care. Operational definition of critically ill patients was adults aged ≥ 18 years who either stayed at least 48 hours or expired in the ICU during admission to a tertiary care center or general hospital. Operational definition of pulmonary disorder group, the test group, was critically ill patients with a KCD-7 code for a respiratory disease as the main diagnosis at the time of admission to the ICU (Supplementary Table 1). Operational definition of non-pulmonary disorder group, the control group, was critically ill patients who had some other medical illness as the main diagnosis at the time of entering the ICU. Patients who were admitted to the ICU after surgery were not included in the control group.
Measurement of variables
We evaluated the critically ill patients’ socio-demographic characteristics such as age, sex, residence in urban or rural areas, particulate matter 10 mm or less in diameter (PM10) or ozone concentration change from the prior year, the number of total or tertiary healthcare units per area (10 km2), the decile of income, Charlson comorbidity index (CCI), and severity of disability. Data regarding air pollution was acquired from the homepage of Air Korea (https://www.airkorea.or.kr/index) and has been presented in the Supplementary Table 2. Based on the area in which the patients lived, we calculated the average number of healthcare units per 10 km2 for each region. The CCI was calculated using each patient’s claim documents which recorded their comorbidities and used to categorize them into four groups. Severity of disability was determined according to the criteria for disability (grades 1 to 6) set by the Korean Ministry of Health and Welfare with grades 1 to 2 indicating severe disability, grades 3 to 6 indicating mild disability, and others indicating lack of disability [17]. To evaluate the trends of healthcare resource usage, we analyzed the course of admission to hospital, ICU patient volume, number of days spent in the hospital, number of days spent in the ICU, use of endotracheal tube and mechanical ventilator, number of days of mechanical ventilator usage, and total cost during ICU stay. The course of admission to hospital was defined as where the decision on hospitalization was made before admission. The ICU patient volume was defined as the number of patients who were admitted to an ICU per healthcare unit, and divided into tertile, “High,” Middle,” and “Low.” We assessed clinical outcomes such as the result of ICU discharge, the time to ICU re-admission and mortality, the long-term incidence rate of ICU re-admission and mortality, and most probable major cause of overall mortality. If a patient had multiple admissions to ICUs, the first episode was regarded as the major event during the study period. The cases of intra- or inter-hospital transfer between ICUs were identified using individual identifier numbers and claim bill numbers and considered one episode of ICU admission.
Assessment of outcomes
The primary endpoint was to elucidate current epidemiologic features, trends of healthcare resource usage, and clinical outcomes of critically ill patients who were admitted to ICU for various pulmonary disorders compared with those admitted for other disorders.
Statistical methods
For comparisons between the pulmonary and non-pulmonary disorder groups, categorical variables were evaluated using percentage difference and 95% confidence interval (CI) between proportions. Continuous variables were analyzed using mean difference and 95% CI. Correlation analysis was conducted to evaluate Pearson’s correlation coefficient. Kaplan-Meier curve with log-rank test and hazard ratio (HR) with 95% CI were used to assess differences in cumulative rates of ICU re-admission and mortality. Poisson regression analysis was performed to compare the adjusted incidence rate ratio of ICU re-admission and mortality between the two groups. Subgroup analysis was conducted according to the various entities of pulmonary disorders to determine the number of patients, total cost during ICU stay, in-hospital mortality, and re-admission to ICU for each disorder. We analyzed the relationship of the baseline characteristics and the usage of healthcare resources with in-hospital survival. After testing the proportional hazards assumption, univariable and multivariable analyses with Cox proportional hazards model were conducted to reveal the adjusted impact of pulmonary disorder on the in-hospital mortality in the critically ill patients. Multicollinearity was measured by variance inflation factor and a cut-off value of 4 was regarded as high. All the analyses were conducted using R for Statistical Computing software, version 3.3.3 (R Core Team [2017], Vienna, Austria).
Ethics
The Institutional Review Board Committee of Seoul National University Bundang Hospital examined and approved the protocol of this study and exempted it from the need for informed consent for access to electronic medical records (Institutional Review Board number: X-1706-405-903).
RESULTS
Socio-demographic characteristics of the study population
Among the 997,173 patients in the NSC database, 49,414 (5.0%) had at least one episode of ICU admission from 2006 to 2015, and 12,983 (1.3%) in 383 ICUs were eligible to be categorized as critically ill, as per the operational definition (Fig. 1). Among the critically ill patients, we found that 3,875 (30.0%) were eligible to be included in the pulmonary disorder group and 3,980 (30.7%) received MV. The frequency of patients receiving MV was approximately 2.6 times higher in the pulmonary disorder group than in the control group. Annual proportion of the pulmonary disorder group among the critically ill patients had increased during the 10-year follow-up (compound annual growth rate = 6.3%), with 28.7% being the lowest value, in 2006, and 55.4% being the highest value, in 2013 (Fig. 2).
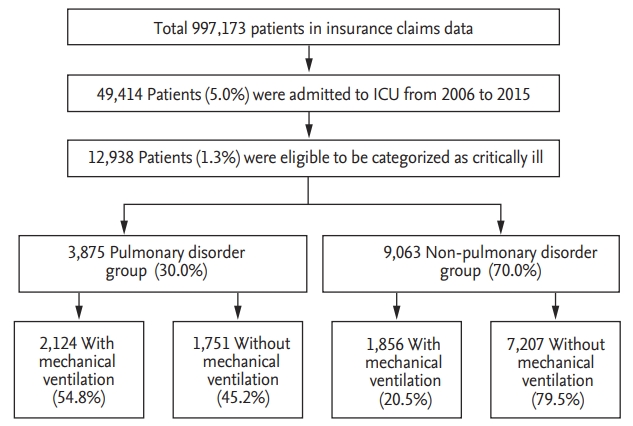
Flow chart of patient inclusion according to operational definition. ICU, intensive care unit.
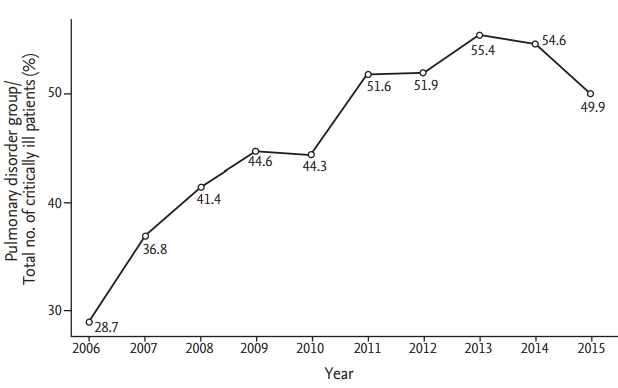
Annual proportion of the pulmonary disorder group out of the total number of critically ill patients.
The patients in the pulmonary disorder group were more likely to be old and male (Table 1). There was no significant difference according to the residence area. More patients in the pulmonary disorder group were found in the areas where the ozone concentration had increased compared with the previous year. The number of total or tertiary healthcare units per area was not significantly different between the two groups. The number of patients using ICU resources for management of critical illness linearly varied according to the incomes. Patients with higher incomes occupied a larger proportion of the critically ill group (Supplementary Fig. 1). In terms of underlying conditions, more patients in the pulmonary disorder group showed a higher CCI score and higher grade of disability than those shown by patients in the non-pulmonary disorder group.
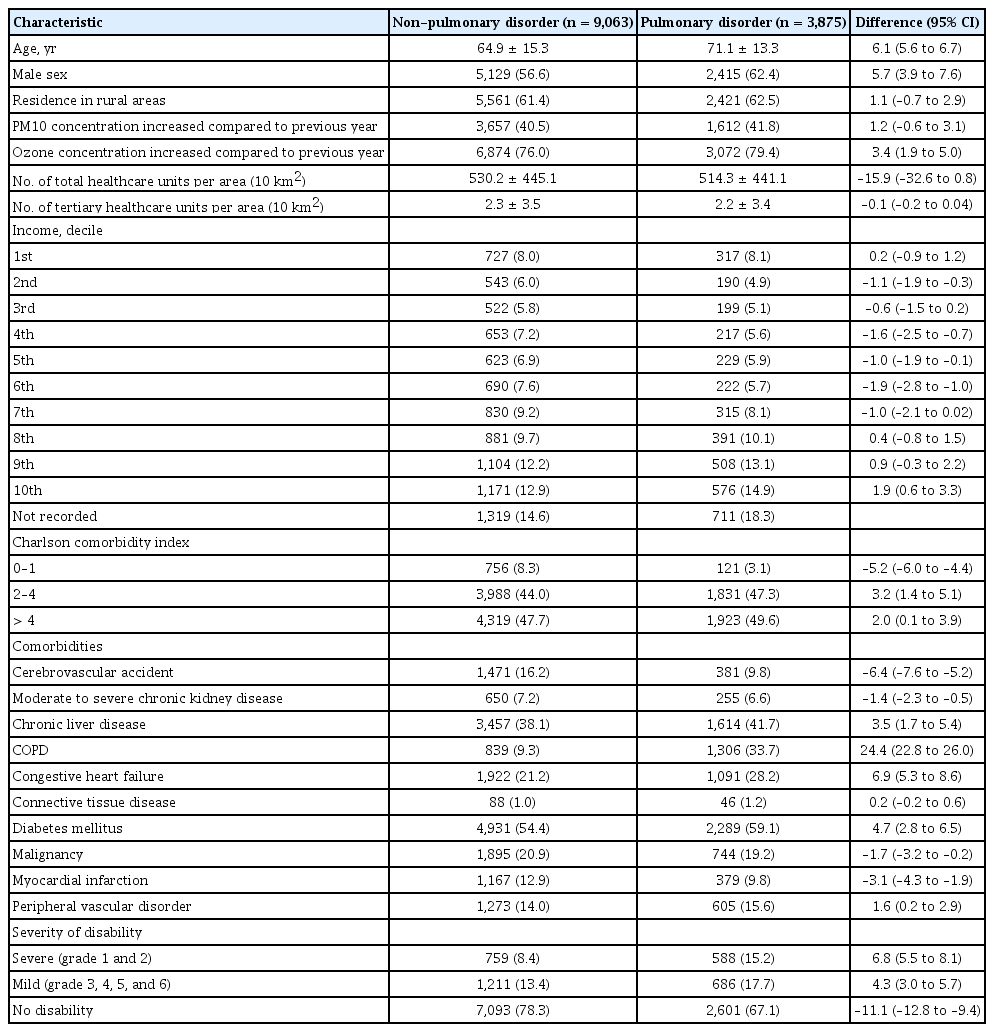
Socio-demographic characteristics of the critically ill patients, including pulmonary and non-pulmonary disorder groups
Utilization of healthcare resources
There was no difference in the course of admission to hospital or ICU volume per healthcare unit between the pulmonary disorder group and non-pulmonary disorder group (Table 2). Patients in the pulmonary disorder group spent 6.2 days more in the hospital and 4.5 days more in the ICU than those in the non-pulmonary disorder group. Patients in the pulmonary disorder group were approximately 34.3% more likely to use an endotracheal tube and a mechanical ventilator for 2.6 days more than those in the non-pulmonary disorder group. In the pulmonary disorder group, the total cost during ICU stay and number of patients in the third tertile of ICU cost, who needed more hospital expenditure than other patients, was higher than for those in the non-pulmonary group. Among the pulmonary disorder group, patients with empyema, neoplastic disorder, and ARDS needed higher expenditure than other patients (Supplementary Table 3).

Difference of the utilization of healthcare resources between pulmonary and non-pulmonary disorder groups
Comparison of clinical outcomes after intensive care
Patients in the pulmonary disorder group were more likely to die in hospital, whereas a higher proportion of patients in the non-pulmonary disorder group were more likely to be discharged to home or the previous healthcare unit (Table 3). More patients in the pulmonary disorder group were re-admitted to ICU after discharge. In the Kaplan-Meier curves used to estimate time to overall death and re-admission to ICU from the initial ICU admission, the pulmonary disorder group showed significantly lower survival rate (log-rank p < 0.001; HR, 1.78; 95% CI, 1.69 to 1.87) and higher rate of re-admission to ICU (log-rank p < 0.001; HR, 2.07; 95% CI, 1.90 to 2.25) (Fig. 3). The ratios of the unadjusted and adjusted incidence rate in terms of both overall mortality and re-admission to ICU were higher in the pulmonary disorder group (Table 4). The analysis for the most probable major cause of overall mortality revealed that, although majority of the patients in the pulmonary disorder group died of pulmonary disorder (44.9%), more than half died of other disorders, such as cardiovascular disorder (19.5%) (Supplementary Table 4).

Comparison of clinical outcomes after intensive care between pulmonary and non-pulmonary disorder groups

Kaplan-Meier curve to evaluate the time to death and intensive care unit re-admission. (A) Survival rate. (B) Re-admission rate.
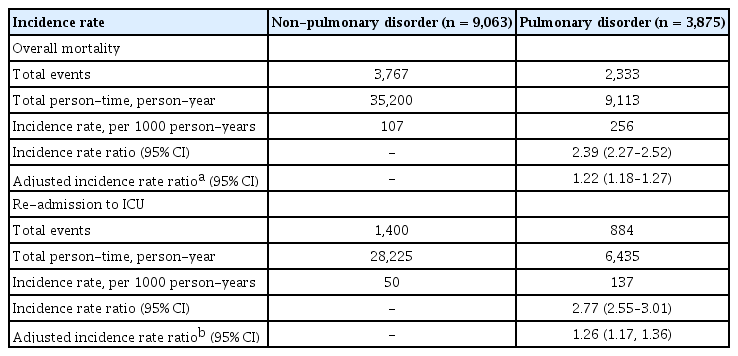
Comparison of unadjusted and adjusted incidence rates of mortality and re-admission to ICU between pulmonary and non-pulmonary disorder groups
The subgroup analysis according to entities of pulmonary disorder revealed that half of the total patients in the pulmonary disorder group were admitted to ICU for treating pneumonia, while in-hospital mortality rate was higher for interstitial lung disease (ILD) and ARDS than for other disorders (Supplementary Table 3). The two disorders with the highest rate of re-admission to ICU were pleural effusion and pneumonitis. We found three different patterns of survival curve among the various pulmonary disorders (Fig. 4). One was pattern A, in which the survival rate drops sharply at the initial stage of the ICU admission, such as that for ARDS, respiratory failure, pneumonia, pneumonitis, ILD, and neoplastic disorder. Another is pattern B, in which survival rate decreases gradually over time, such as that for pneumothorax, pleural effusion, and chronic airway disease. Pattern C is one which does not show difference in survival rate compared with the non-pulmonary disorder group, such as that for pulmonary embolism, lung abscess, and empyema.
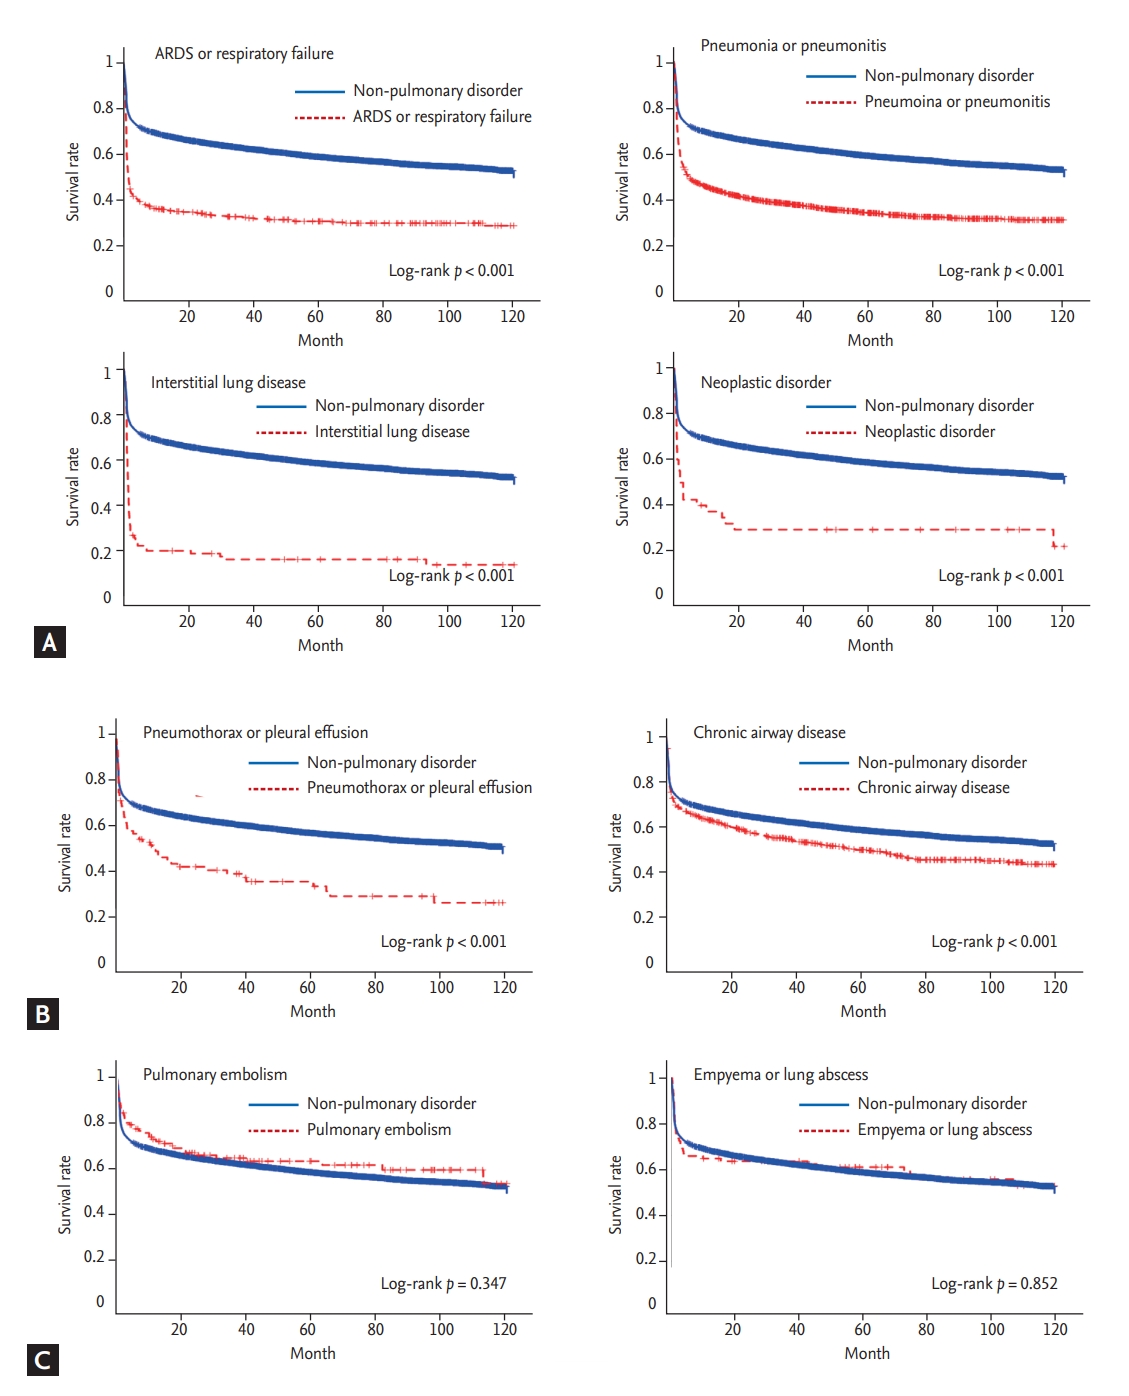
Kaplan-Meier curve to evaluate the time to death according to various entities of pulmonary disorder. (A) It is a pattern in which the survival rate drops sharply at the initial stage of the intensive care unit admission. (B) It is a pattern in which survival rate decreases gradually over time. (C) It is a pattern in which survival rate was not different between the pulmonary disorder and non-pulmonary disorder groups. ARDS, acute respiratory distress syndrome.
Age, sex, air pollution, income, CCI score, disability, pulmonary disorder as the main cause of ICU admission, course of admission to hospital, and ICU patient volume were associated with in-hospital mortality (Supplementary Tables 5 and 6). The cases of critically ill patients, mainly with pulmonary disorder, were significantly related to in-hospital mortality in the unadjusted and adjusted regression analyses with Cox proportional hazards model (Table 5). In addition, higher age, male sex, decreased concentration of PM10, disability, admission to hospital via outpatient clinic, and low ICU patient volume were significantly associated with a higher risk of in-hospital mortality, after adjustment. Risk factors of in-hospital mortality were different between the pulmonary disorder group and non-pulmonary disorder group (Supplementary Table 7). Patients in the pulmonary disorder group who lived in an urban area had a higher risk of in-hospital mortality (HR, 1.12; 95% CI, 1.00 to 1.26). In contrast, disability, admission course, and ICU patient volume were not associated with in-hospital mortality in the pulmonary disorder group.
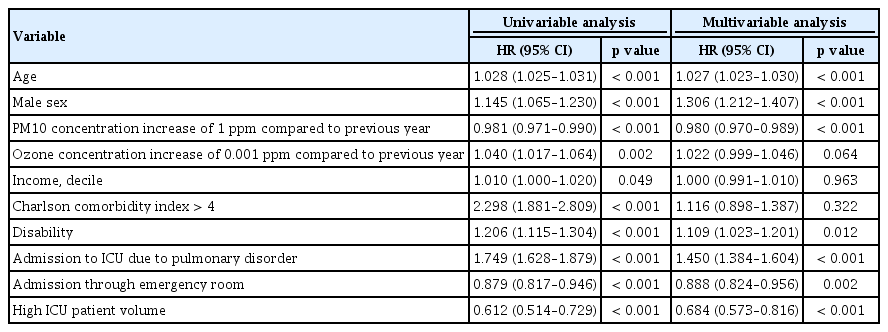
Results of unadjusted and adjusted regression analysis with Cox proportional hazards model to evaluate the risk of in-hospital mortality
DISCUSSION
The present study yielded extensive epidemiologic results from the insurance claims data for a single insurer, from the national healthcare system. The proportion of the critically ill patients with pulmonary disorder as the major cause of admission had increased annually for 10 years. The patients in the pulmonary disorder group were likely to have more comorbidities or disabilities in the rural areas with relatively lower access to healthcare units. More medical resources were needed for the pulmonary disorder group in terms of longer hospital stay and use of mechanical ventilator for a longer period. After adjustment, incidence rates of overall mortality and re-admission to ICU were higher in the pulmonary disorder group. Poor clinical outcomes were mainly due to ARDS, pneumonia, ILD, and neoplasm in the short term, and chronic airway and pleural diseases in the long term. Among different types of pulmonary disorders, ARDS contributed more to higher proportions of clinical and economic burdens than others.
Previous studies have shown that respiratory disease is one of the main disorders that require intensive care, and that the prognosis is poor in patients admitted to ICU due to various respiratory diseases [8-13,18,19]. The incidence and proportion of respiratory disease in the community has been increasing in recent years because of the increasing aging population, excessive body weight due to westernization, increased morbidity of chronic pulmonary disorders, and long-term air pollution exposure [20-22]. In our study, the percentage of critically ill patients with respiratory disease as the main cause of ICU admission increased annually. This trend, at a community level, may indicate an important public health problem which not only changes the quality of life but also affects the use of medical resources and clinical burdens in ICU. In the pulmonary disorder group, the most common cause of death was pulmonary disorder, but other comorbid diseases, such as cardiovascular disorders, should also be noted because deterioration of other organ functions is common in hypoxic conditions [23,24].
We found that the patients with a lower income had a lower possibility of receiving critical healthcare, regardless of the patient group. It would be more reasonable to interpret this finding as lower economic access to critical healthcare than as a lower incidence of critical illness in these people. In critically ill patients, it has been reported that access to critical healthcare was limited by low socio-economic status [25]. In addition, the patients living in the areas with lower economic status were likely to receive less appropriate intensive care for ARDS [26]. In our study, the critically ill patients with a higher income had a lower risk of in-hospital mortality, after multivariate adjustment. In domestic healthcare delivery systems, there is a high probability that the patients with low income would have a lower access to intensive medical care, which may cause the problem of medical inequality.
The mean concentration of PM10 had been generally decreasing annually from 2002 to 2015 in South Korea. The annual reduction in the average concentration of PM10 over the previous year did not reduce, rather increased, the incidence of pulmonary disorder or in-hospital mortality in the critically ill patients. However, there are limitations in describing causality, since our analysis did not include sufficient confounding factors for PM10 concentration, and the results were not obtained from spatiotemporal analysis. Rather, this result may indicate that the effects of other factors on in-hospital mortality are more significant than that of annual change of mean PM10 concentration. Previous studies have shown that short-term exposure to particulate matter for 3 or 4 days increased the number of emergency room visits or ICU admission, whereas the relationship between long-term exposure to particulate matter and critical illness was poorly studied [27,28]. A rapid change in PM10 concentration over a few days may be more important for the course of acute critical illness than an annual change in the mean PM10 concentration. To accurately determine the effect of PM10 concentration on severe respiratory illness, it is necessary to construct a cohort prospectively and to perform spatiotemporal analysis by deliberately including confounding variables.
Although there was no significant difference in residential areas between the pulmonary disorder and non-pulmonary disorder groups, the pulmonary disorder group had a higher risk of in-hospital mortality for people living in urban areas. It is controversial whether there is a difference in the mortality rate due to respiratory disease depending on the residence area. In asthma, urban populations were associated with lower mortality [29]. In chronic obstructive pulmonary disease, mortality was higher in the rural areas [30]. The clinical outcome of pneumonia was not different between rural and urban areas [31]. In large epidemiologic studies, higher cardiopulmonary mortality was reported in urban area residents than rural residents; this was mostly associated with higher levels of air pollution [32,33]. In order to determine whether the higher mortality rates in urban areas in the pulmonary disorder group are related to air pollution level, it is necessary to study air pollution data, including more sophisticated and various substances, in the future.
The major strengths of our study are the large sample population and long-term follow-up duration of a well-verified nation-wide cohort, which represents the entire South Korean population. Another advantage of this study is the reliability of the socio-demographic data, which is difficult to obtain from individual research institutes. These strengths enable us to have adequate statistical power for sophisticated analyses of the socio-demographic and clinical variables, and the results are generalizable and reproducible in terms of the use of medical resources in the real world.
There are some limitations to this study. First, the characteristics of the non-pulmonary disorder group were heterogeneous but were not further analyzed. The non-pulmonary disorder group, which included general critically ill patients with various diseases, was introduced only for comparison with the pulmonary disorder group and was not the main focus of this study. Second, the operational definition of critically ill patients using the claims data may not be sufficient because of the lack of clinical information in the claims data. Some critically ill patients may not have been included in this study because they died before being admitted to the ICU [34] or were successfully managed in general wards. Third, like the previous studies using medical insurance claim data [35,36], the present study has also a limitation in terms of analysis of the clinical information or severity of major diseases. Although the classification of patients according to the main diagnosis has limitations, it is expected that the characteristics of the pulmonary disorder group would not be significantly different from those of ICU patients who actually suffered from respiratory diseases. Our study is significant as it is the first attempt at an epidemiologic study on pulmonary disorders in the ICU, which will help to further elaborate a hypothesis in this research area. Fourth, patients’ or their family’s decisions on treatment, such as “Do-Not-Resuscitate,” withdrawal of treatment, and withholding treatment, were not included in our study. End-of-life care is one of the most important current issues in ICU care. Because the treatment code for end-of-life care is now legally established, it is expected to be available for future research.
In conclusion, critically ill patients with pulmonary disorder as the main diagnosis are more likely to use healthcare resources; however, their clinical outcomes are significantly worse than those of the non-pulmonary disorder group. Although the interpretation of claim data is limited, it was followed up for a prolonged period to analyze and elucidate the socio-demographic characteristics and clinical outcomes of patients with respiratory diseases in the ICU.
KEY MESSAGE
1. This population-based observational study clarifies the characteristics and clinical outcomes of critically ill patients with pulmonary disorder.
2. This study indicates that the use of healthcare resources was significantly higher for critically ill patients with pulmonary disorder than those with other disorders.
3. Moreover, the clinical outcomes of this patient group were significantly worse than those of patients with other disorders.
Supplementary Materials
Disease, admission, and treatment codes used to identify the patients who were eligible for the operational definition
Subgroup analysis of the proportion of the patients, in-hospital mortality, re-admission to ICU, and total cost of ICU stay according to various entities of the pulmonary disorder group
Most probable major cause of overall death in the critically ill patients who expired
Baseline characteristics of critically ill patients, according to in-hospital survival status
Utilization of healthcare resources in critically ill patients, according to in-hospital survival status
Notes
No potential conflict of interest relevant to this article was reported.
Acknowledgements
This study was funded by the Seoul National University Bundang Hospital Research Fund (grant no. 13-2018-014).