Atrial conduction times and left atrial mechanical functions and their relation with diastolic function in prediabetic patients
Article information
Abstract
Background/Aims
The aim of this study was to investigate atrial conduction times and left atrial mechanical functions, the noninvasive predictors of atrial fibrillation, in prediabetic patients with impaired fasting glucose (IFG) and impaired glucose tolerance (IGT).
Methods
Study included 59 patients (23 males, 36 females; mean age 52.5 ± 10.6 years) diagnosed with IFG or IGT by the American Diabetes Association criteria, and 43 healthy adults (22 males, 21 females; mean age 48.5 ± 12.1 years). Conventional and tissue Doppler echocardiography were performed. The electromechanical delay parameters were measured from the onset of the P wave on the surface electrocardiogram to the onset of the atrial systolic wave on tissue Doppler imaging from septum, lateral, and right ventricular annuli. The left atrial volumes were calculated by the disk method. Left atrial mechanical functions were calculated.
Results
The mitral E/A and E’/A’ ratios measured from the lateral and septal annuli were significantly lower in the prediabetics compared to the controls. The interatrial and left atrial electromechanical delay were significantly longer in prediabetic group compared to the controls. Left atrial active emptying volume (LAAEV) and fraction (LAAEF) were significantly higher in the prediabetics than the controls. LAAEV and LAAEF were significantly correlated with E/A, lateral and septal E’/A’.
Conclusions
In the prediabetic patients, the atrial conduction times and P wave dispersion on surface electrocardiographic were longer before the development of overt diabetes. In addition, the left atrial mechanical functions were impaired secondary to a deterioration in the diastolic functions in the prediabetic patients.
INTRODUCTION
It is well known that, as for most cardiovascular disorders, diabetes is an independent risk factor for atrial fibrillation (AF), and that the risk of AF is 1.4 to 2.1 times greater in patients with diabetes than the normal population [1]. The prediabetic stage is a term used to describe a group of patients that is at high risk for developing diabetes and it comprises patients with impaired glucose tolerance (IGT) and impaired fasting glucose (IFG). Previous studies have shown that all stages of glucose abnormality are associated with higher cardiovascular mortality and morbidity and thus they should be diagnosed and eliminated as early as possible [2].
Electromechanical delay (EMD) has been defined as the temporal delay between the detected onset of electrical activity and the realization of force in the myocardium [3,4]. The prolongation of the intra-atrial and interatrial conduction time can be evaluated by simple electrocardiographic (ECG) markers such as maximum P wave duration (Pmax) and P wave dispersion (PWD) as well as by the tissue Doppler method [3,4]. Prolonging atrial conduction time, as measured by tissue Doppler imaging (TDI), is an independent predictor of new onset or recurrent AF [3,4].
The left atrium (LA) functions as a reservoir during systole, a conduit during early diastole and an active contractile chamber in late diastole [5,6]. These LA functions mechanically facilitate the transition between flow through the pulmonary venous circulation and the intermittent filling of the left ventricle [6,7].
This study investigated LA conduction times and LA mechanical functions that are predictors of AF and discussed possible mechanisms of AF development in patients with IFG and IGT at a prediabetic stage.
METHODS
This study included 59 patients (23 males, 36 females; mean age, 52.5 ± 10.6 years) free of hypertension, coronary artery disease, valvular heart disease, cerebrovascular disease, overt diabetes, or collagen vascular disease who were diagnosed with IFG (an elevated fasting plasma glucose concentration, 100 and 126 mg/dL) and IGT (an elevated 2-hour plasma glucose concentration, 140 and 200 mg/dL) after a 75-g glucose load on the oral glucose tolerance test in the presence of a fasting plasma glucose concentration 126 mg/dL according to American Diabetes Association (ADA) 2013 criteria [8] at endocrinology and metabolism and cardiology clinics after applying with various complaints. Control group were selected from the healthy population with normal fasting blood glucose (FBG; 43 healthy subjects: 22 males, 21 females; mean age, 48.5 ± 12.1 years) who were admitted with any reason to cardiology and endocrinology departments and detected no cardiac and metabolic problem. Demographic characteristics of the subjects were recorded and a detailed history was taken and physical examination was performed. The body surface area (BSA) was calculated with the Mosteller formula and the body mass index (BMI) with the formula of BMI = weight/height2. Twenty-four-hour holter recordings were performed for all partipicants to exclude the potential association of asymptomatic paroxysmal AF. All procedures were carried out in accordance with the ethical standards of the responsible committee on human experimentation (institutional and national) and with the Helsinki Declaration of 1975, as revised in 2008. All participants gave informed written consent. Local ethic committee approved the study.
Subjects with the following characteristics were excluded
(1) Previous myocardial infarction
(2) Left bundle branch block on ECG
(3) Previous coronary invasive procedures or thrombolytic therapy
(4) History of any rhythm disorder
(5) History of coronary bypass surgery
(6) Dilated cardiomyopathy
(7) Inadequate image quality on echocardiography
(8) History of paroxysmal AF
(9) Previous coronary percutaneous intervention
(10)Hypertension
(11) Diabetes mellitus and/or drug use for diabetes mellitus
(12)Use of drugs that affect cardiac conduction system
(13) Obstructive sleep apnea or chronic obstructive pulmonary disease
(14)Chronic renal failure
(15) Patients detected AF on 24-hour holter recordings
Electrocardiography
The 12-lead surface ECG were obtained using an ECG device (Agilent, Andover, MA, USA) with the subjects in supine position. The paper speed was set at 50 mm/sec and the ECG amplitude at 20 mm/mV. During the recording the subjects were allowed to breathe normally and were not permitted to hold breath or speak. The measurements were performed with max-extra compass steel 150 mm digital ECG device. The measurements were calculated by taking the mean of the three waves examined in each derivation. The take-off of the P wave from the isoelectric line was accepted as the onset of P wave and the point where it re-intersected the isoelectric line was accepted as the end of P wave (Fig. 1). PWD was calculated as the difference between the longest and shortest P wave durations on 12-lead ECG. ECG measurements were made by a single observer.

Figure showing measurement of P wave duration on 12-lead surface electrocardiographic (ECG) of a patient (lead DI). The paper speed was set at 50 mm/sec and the ECG amplitude at 20 mm/mV.
Echocardiography
All subjects in both groups underwent echocardiography with GE VingMed Vivid 7 device (GE Vingmed Ultrasound, Horten, Norway). The echocardiographic examination was performed with the patients lying in left supine position. Parasternal long axis, short axis, apical four- and two-chamber images were obtained and measurements and assessments were done with M-mode, two-dimensional, continuous wave Doppler, pulsed wave Doppler, and TDI according to the criteria of American Society of Echocardiography [9]. All echocardiographic procedures were performed by a single operator. The subjects were asked not to smoke or consume caffeinated beverages within 1 hour before the measurements. Left ventricular systolic and diastolic functions were evaluated. Left ventricular end diastolic diameter and left ventricular end systolic diameter, and of interventricular septum (IVS) and posterior wall (PW) thicknesses were calculated with the M-mode. Left ventricular ejection fraction was calculated using the modified Simpson method. Other conventional echocardiographic parameters (LA diameter, mitral E and A waves, E wave deceleration time [EDT], isovolumic relaxation time [IVRT], ejection time [ET], isovolumic contraction time [ICT]) were also measured. A continuous single-lead electrocardiographic recording was made during echocardiography. Myocardial performance index was calculated using the formula of ICT + IVRT / ET.
Tissue Doppler echocardiography was performed using a 2.5 to 3.5 MHz transducer. In apical four-chamber window the pulsed Doppler sample volume was placed at the basal portion of the IVS and at the junction of the mitral and tricuspid annuli with the ventricular free wall. The amplitudes of the systolic wave (S’), early diastolic wave (E’), and late diastolic wave (A’) were individually measured for septum, lateral, and tricuspid annulus. Peak E wave velocity obtained via pulsed-wave Doppler and E’ velocity determined via tissue Doppler were proportioned to each other for left and right ventricle.
Electromechanical coupling
The time from the onset of P wave on ECG to the onset of late diastolic wave (A’) in tissue Doppler recordings was considered as the atrial electromechanical coupling (PA) (Fig. 2). The measurements were obtained from lateral mitral annulus (PA lateral), septal mitral annulus (PA septal), and right ventricular tricuspid annulus (PA tricuspid). The difference between PA lateral and PA tricuspid was defined as inter-atrial electromechanical delay (AEMD), the difference between PA septum and PA tricuspid as intra-AEMD, and the difference between PA lateral and PA septal as left atrial electromechanical delay (LAEMD).

Figure showing measurement of the PA (electromechanical coupling) interval with tissue Doppler imaging, which denotes time interval from the onset of P wave on the surface electrocardiogram to the onset of the lateral late diastolic wave (A’ wave).
Left atrial mechanical functions
LA volume measurements were performed with the disk method from the apical four-chamber window. Maximum left atrial volume (Vmax) was recorded just at the time of mitral valve opening; minimum left atrial volume (Vmin) was recorded just at the time of mitral valve closure; presystolic left atrial volume (Vp) was recorded at the onset of atrial systole (P wave on ECG). All LA volumes were corrected by BSA. End diastolic and end systolic left ventricular volumes and BSA ratios were recorded. LA emptying functions were calculated with the following formula:
Left atrial passive emptying volume (LAPEV) = Vmax – Vp
Left atrial passive emptying fraction (LAPEF) = LAPEV / Vmax
Left atrial active emptying volume (LAAEV) = Vp – Vmin
Left atrial active emptying fraction (LAAEF) = LAAEV / Vp
Left atrial total emptying volume (LATEV) = Vmax – Vmin
Conduit volume = left ventricle stroke volume – LATEV [10].
Statistical analysis
The statistical analyses of the present study were performed with SPSS version 18.0 (SPSS Inc., Chicago, IL, USA). The continuous variables were presented as mean ± standard deviation and median (minimum–maximum) while the categorical variables were expressed as frequency and percentage. The normality of continuous variables was tested using Shapiro-Wilk test. The intergroup comparison of normally distributed variables was performed with independent samples t test, and the non-normally distributed variables with Mann-Whitney U test. Pearson chi-square test was used for intergroup comparisons of categorical variables. A p value less than 0.05 was considered statistically significant. The intraobserver variability was within acceptable limits.
RESULTS
The demographic characteristics of the groups were presented on Table 1. There were no significant differences between the groups with respect to age, BMI, sex, systolic and diastolic blood pressures and pulse rate at the time of echocardiographic measurements (Table 1). Pmax and PWD durations were significantly longer in prediabetics compared to the control group (118.6 ± 11.6 vs. 113.4 ± 9.3, p = 0.024; 55.3 ± 11.1 vs. 28.9 ± 6.0, p < 0.001), respectively), whereas minimum P wave duration was significantly shorter (63.3 ± 8.1 vs. 84.5 ± 9.1, p < 0.001).
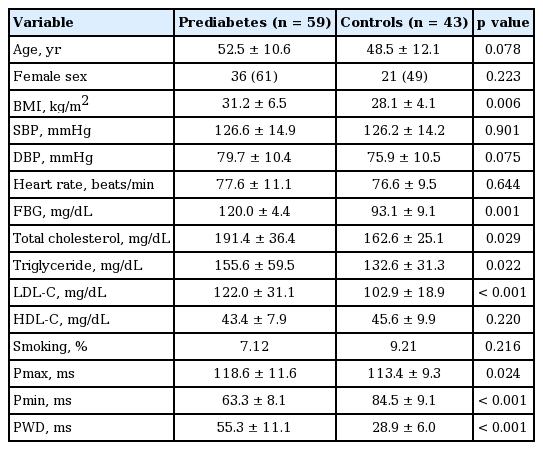
Demographic and electrocardiographic data of the groups
Among conventional echocardiographic parameters, left ventricular systolic, diastolic diameters, LA diameter, and septal and PW thicknesses were significantly greater in the prediabetic group than the control group (Table 2). Among pulsed wave Doppler parameters measured from mitral valve, E/A ratio was significantly lower in the prediabetics (Table 2). The prediabetic group and the control group had similar EDT, ET, and IVRT, while the prediabetics had a significantly longer ICT (Table 2). The prediabetic group had a significantly lower lateral and septal annulus E’ wave and a significantly higher septal annulus A’ wave. Lateral annulus A’ wave was higher although it did not reach statistical significance (Table 2). Both groups were similar with respect to the ratio of mitral E wave to E’ wave measured from lateral and septal annuli (Table 2). The prediabetic group had a significantly lower E’/A’ ratios measured from lateral and septal annuli (Table 2).
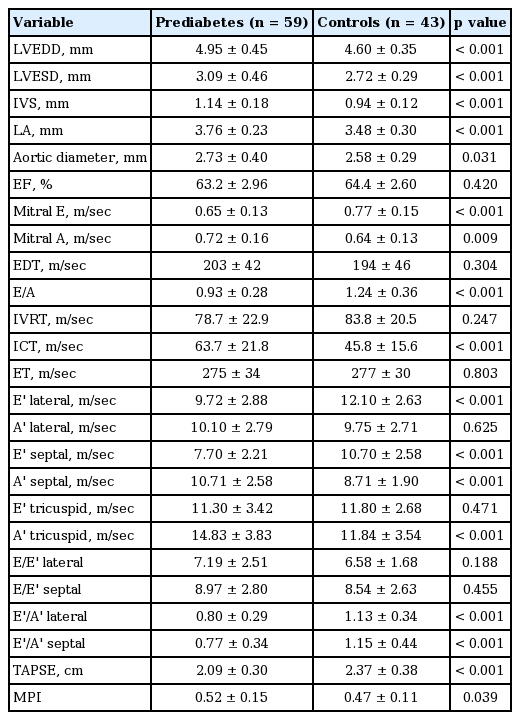
Comparison of conventional and tissue Doppler parameters and diastolic functions of left ventricle
As for the parameters indicating LA mechanical functions, LAAEV and fraction were significantly higher in the prediabetics compared to the controls. LAPEV and fraction were also lower in the prediabetics, albeit statistically nonsignificant (Table 3).
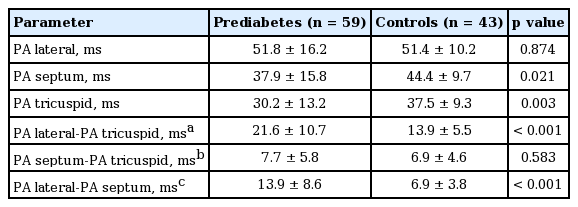
Comparison of electromechanical coupling parameters of the groups.
A comparison of the atrial electromechanical coupling parameters revealed a significantly shorter septal and right atrial delay in the prediabetics compared to the controls. Interatrial and LA delays were significantly greater in the prediabetic subjects compared to the controls (Table 4).
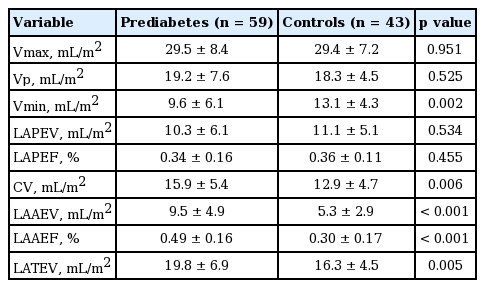
Left atrial volume measurements of the groups
An analysis of the relationship between diastolic functions and the parameters indicating left ventricular mechanical functions showed that there was a significant negative correlation between LAAEV, LAAEF, and mitral E/A ratio (r = –0.42, p < 0.000; r = –0.28, p = 0.008, respectively), lateral E’/A’ (r = –0.24, p = 0.027; r = –0.27, p = 0.01, respectively), and septal E’/A’ (r = –0.45, p < 0.000; r = –0.33, p = 0.002, respectively). Similarly, there was a significant albeit weak negative correlation between mitral E/A ratio and interatrial EMD, LAEMD (r = –0.31, p = 0.003; r = –0.37, p <0.000, respectively).
We performed multivariate regression analysis on interatrial EMD, intra-atrial EMD and LAEMD individually. Regression analysis revealed that main factors related with LAEMD are mitral E/A ratio, septal E’/A’, and FBG (β = –0.32, p = 0.09; β = 0. 25, p = 0.048; β = 0.38, p = 0.001, respectively). On the other hand the main factors related with interatrial EMD are BMI, FBG, and septal E’/A’ (β = 0.28, p = 0.007; β = 0.43, p < 0.001; β = 0.31, p = 0.015, respectively). No relationship was existing between age, sex, and atrial EMD.
DISCUSSION
AF is the most common arrhythmia in clinical practice and associated with risk of increased mortality, stroke, and heart failure [11]. Various cardiac and noncardiac risk factors including advanced age, obesity, hypertension, and female sex are considered to have a role in AF development. Therefore, it is as important to determine and eliminate risk factors for AF as treatment of AF and its consequences [12]. Subjects with IFG and IGT are collectively said to be in a prediabetic stage and are at relatively increased risk for future overt diabetes mellitus. ADA recommended that IFG and IGT should not be regarded as separate clinical entities, but as risk factors for cardiovascular disease, much like diabetes mellitus [8].
The close association between hyperglycemic state and AF is a well-known entity. It is considered that in addition to the effects of various risk factors such as coronary artery disease, hypertension, and abnormal autonomic tonus, the effect of hyperglycemia on atrial tissue is also responsible for this association [13]. Chronic hyperglycemia alters the chemical composition of the proteins in the cell membrane; thereby, causing structural and functional injury. Over time, interstitial fibrosis as a consequence of extracellular protein deposition and inflammatory reactions may lead to heterogeneity of atrial conduction and atrial refractoriness [14]. Kato et al. [15] suggested that hyperglycemia activates glycosylation endproducts-receptor system, increasing circulating tissue growth factors and augmenting atrial structural remodeling. Being exposed to higher glucose levels for a long time increases endothelial nitric oxide synthase expression in endothelial cells, but a simultaneous increase in superoxide anions ultimately results in nitric oxide (NO) inactivation. In addition, advanced glycosylation products also cause NO inactivation [16]. An additional possible mechanism is the close relationship between inflammation and AF. It has been suggested that chronic hyperglycemia may activate inflammation. Moreover, higher levels of inflammatory markers such as C-reactive protein have already been demonstrated [17]. It should be remembered that hypoglycemia is as closely related to AF as hyperglycemia does; it may be speculated that fluctuations in metabolic control are another cause of AF [13]. The above mentioned factors are considered to lead to AF by causing chronic alterations in atrial tissue; thereby, inducing heterogeneity in atrial conduction time and atrial refractoriness [13]. In the present study we did not investigated the existence of structural injury in atrial cells or the inflammatory markers in prediabetic patients. However, we found significantly longer interatrial and LA delays, which are predictors of AF development, in the prediabetics compared to the controls. This finding suggests that prediabetic patients may be prone to AF even before the emergence of overt diabetes. Similarly, PWD, a noninvasive method to predict AF, was significantly greater in the prediabetic subjects than the controls, a finding that supported our tissue Doppler results. Furthermore, we suggest that this method, when sufficiently improved, may determine prediabetic subjects who are susceptible for AF. Regression analysis revealed a weak relationship between FBG and interatrial and LAEMD. This result may support the susceptibility to A in this group of patients. Rosenberg and Manning [18] reported that there was a significant association between diastolic dysfunction and AF, which originated from increased filling pressures and LA stretch in the absence of structural heart disease. In agreement with Rosenberg and Manning [18], we found a greater LA diameter in the prediabetic group compared with the control group. We also detected a correlation between interatrial EMD and mitral E/A ratio, although it was weak. Regression analysis revealed weak relationship between septal E’/A’ and interatrial EMD. Also a relationship between mitral E/A ratio, septal E’/A’ and LAEMD.
LA mechanical function is an important component of left ventricular filling. The LA functions as a reservoir during systole, a conduit during early diastole, and as an active contractile chamber in late diastole [5]. LA function mechanically facilitates the transition between flow through the pulmonary venous circulation and the intermittent filling of the left ventricle [7]. During diastole, the LA is directly exposed to left ventricular pressure, which increases when left ventricular diastolic function is impaired [19].
LAAEV and LAAEF were also significantly greater in the prediabetic patients compared to the control group in our study. Diastolic functions assessed by both conventional and TDI were significantly more impaired in the prediabetics than the control group. Increased LAAEV and LAAEF suggest that LA provides more support in the active part of diastole. The significant correlation between LAAEV and LAAEF and the parameters indicating diastolic dysfunction support our hypothesis. According to our results, LAPEV and LAPEF were lower in the prediabetics although the difference was not statistically significant. One cause of it may be the small sample size. Another reason may be the exclusion of subjects with certain comorbidities as hypertension and coronary artery disease, who frequently had prediabetes and diastolic dysfunction. We believe that the increased levels of parameters that are indicative of LA emptying are secondary to filling limitation at early diastole. Furthermore, a subclinical myocardial involvement may have been the reason of diastolic limitation and an increased atrial contribution, although such an involvement was not shown by myocardial biopsy or cardiac magnetic resonance imaging.
The basic limitations of our study were the small sample size and its cross-sectional nature. The main limitation was the lack of a registry showing whether the study group later developed AF or heart failure. We also did not determine what percentage of our prediabetic subjects developed overt diabetes. It may also been relevant to explore the effects of certain therapies (weight loss, exercise, metformin) at prediabetic stage on LAEMD and LA mechanical functions. Since patients with longer PWD and atrial EMD are at increased risk for future AF development, lack of an electrophysiological study was another limitation of our study. Most of the patients with IFG and IGT have some characteristic features like higher body mass indices, higher age, female sex. In our study although it was not statistically significant, prediabetic group included older age, higher proportion of female sex, and higher BMI. These factors may have impact in the difference of echocardiographic parameters between the groups as the prediabetic state.
In conclusion, increased electrocardiographically measured PWD and echocardiographically measured inter-AEMD and LAEMD in prediabetic subjects suggest that the tissue Doppler method may also be noninvasive qualitative method for indirect assessment of atrial substrate. We determined that LA mechanical functions and LA conduction times were impaired before the development of overt diabetes. A prolonged LAEMD may be both a predictor of AF development and a sign of subclinical cardiac involvement. We also think that in these patients LA mechanical functions are impaired maybe due to the poor diastolic functions. We suggest that appropriate medications against diastolic dysfunction in this subset of patients may improve LA mechanical functions and thus delay progression to heart failure and enhance quality of life. Studies with longer follow-up duration may further clarify this subject.
KEY MESSAGE
1. Left atrial mechanical functions and left atrial conduction times might be impaired before the development of overt diabetes.
2. A prolonged left atrial electromechanical delay may be both a predictor of atrial fibrillation development and a sign of subclinical cardiac involvement.
Notes
No potential conflict of interest relevant to this article was reported.