Diagnostic accuracy of 22/25-gauge core needle in endoscopic ultrasound-guided sampling: systematic review and meta-analysis
Article information
Abstract
Background/Aims
To compare the diagnostic accuracy of endoscopic ultrasound-guided core needle aspiration with that of standard fine-needle aspiration by systematic review and meta-analysis.
Methods
Studies using 22/25-gauge core needles, irrespective of comparison with standard fine needles, were comprehensively reviewed. Pooled sensitivity, specificity, diagnostic odds ratio (DOR), and summary receiver operating characteristic curves for the diagnosis of malignancy were used to estimate the overall diagnostic efficiency.
Results
The pooled sensitivity, specificity, and DOR of the core needle for the diagnosis of malignancy were 0.88 (95% confidence interval [CI], 0.84 to 0.90), 0.99 (95% CI, 0.96 to 1), and 167.37 (95% CI, 65.77 to 425.91), respectively. The pooled sensitivity, specificity, and DOR of the standard needle were 0.84 (95% CI, 0.79 to 0.88), 1 (95% CI, 0.97 to 1), and 130.14 (95% CI, 34.00 to 495.35), respectively. The area under the curve of core and standard needle in the diagnosis of malignancy was 0.974 and 0.955, respectively. The core and standard needle were comparable in terms of pancreatic malignancy diagnosis. There was no significant difference in procurement of optimal histologic cores between core and standard needles (risk ratio [RR], 0.545; 95% CI, 0.187 to 1.589). The number of needle passes for diagnosis was significantly lower with the core needle (standardized mean difference, –0.72; 95% CI, –1.02 to –0.41). There were no significant differences in overall complications (RR, 1.26; 95% CI, 0.34 to 4.62) and technical failure (RR, 5.07; 95% CI, 0.68 to 37.64).
Conclusions
Core and standard needles were comparable in terms of diagnostic accuracy, technical performance, and safety profile.
INTRODUCTION
Endoscopic ultrasound-guided fine-needle aspiration (EUS-FNA) has become the main diagnostic procedure for pancreaticobiliary disorders, in particularly pancreatic cancer. Pooled sensitivity and specificity of EUS-FNA have been reported to be 85% to 86.8% and 95.8% to 98%, respectively [1,2]. Although EUS-FNA is an effective diagnostic tool for the determination of correct etiology for solid pancreatic masses, it has several limitations. Cytological investigation of the aspirated materials is only able to establish cellular diagnosis. Certain neoplasms, such as lymphomas and gastrointestinal stromal tumor, are difficult to diagnose without histologic samples, because in these cases, knowledge of the tissue architecture and original arrangement are essential for accurate pathological diagnosis including immunohistochemical analysis [3,4].
Due to the intrinsic limitations of cytology sampling, EUS-Trucut biopsy with a 19-gauge (G) needle and 19 G biopsy needle with reverse bevel technology were developed to enable the procurement of tissue core for histologic analysis [5,6]. However, some technical difficulties still remain when performing transduodenal passage. Recently, 22 and 25 G fine needle biopsy devices with reverse bevel technology have become available to facilitate transduodenal sampling [7]. However, it is uncertain if novel core needle increases the diagnostic accuracy by obtaining sufficient amount of tissue. The aim of this study was to perform a systematic review and meta-analysis to determine the diagnostic accuracy of 22/25 G EUS-guided core needle aspiration in comparison with that of standard FNA.
METHODS
Search strategy
Our study was performed according to the recommendations on the conduct and reporting of systematic reviews and meta-analyses outlined by the Preferred Reporting Items in Systematic Reviews and Meta-Analyses statement [8], the Meta-Analysis of Observational Studies in Epidemiology [9], and the Cochrane Diagnostic Test Accuracy Working Group [10]. We conducted a literature search of Ovid MEDLINE, EMBASE, and Cochrane Central Register of Controlled Trials (CENTRAL) from the earliest available date of indexing through to March 23, 2015.
The search terms included “Core needle,” “Pro Core,” “Procore,” “Core biopsy,’ “Histology EUS needle,” “EUS histology needle,” “biopsy needles for EUS,” and “side fenestration.” The literature search included potential studies without language, publication date, or other restrictions. We also checked the reference lists of all included studies for additional references.
Study selection
Studies were included if they met the following criteria: (1) randomized clinical trial, cohort study, or case-control study; (2) clinical trial based on humans, rather than animals; (3) histologically proven diagnosis; (4) evaluated the accuracy, sensitivity or specificity of core needle; and (5) absolute numbers of true-positive (TP), false-positive (FP), false-negative (FN), and true-negative (TN) results reported, or data were derivable from the published results. Two authors (H.C.O. and J.Y.L.) examined the titles and abstracts of references identified by the electronic search strategies described above to check the relevance of each study. Studies considered potentially relevant in the search were obtained as full articles and independently assessed for inclusion by the same two authors. Any disagreement was discussed and solved by a third reviewer (J.S.C.).
Data extraction and quality assessment
Two authors (H.K. and G.J.C.) used a structured, pilot-tested, Excel data collection form to independently extract the data from the included studies. Extracted data included the following study characteristics: (1) name of first author; (2) year of publication; (3) name of journal; (4) study design; (5) number of patients; (6) detection methods; (7) size of core or FNA needle used; (8) absolute numbers in TP, FP, FN, and TN arms, or any data from which this information was derivable; (9) existence of technical failure, overall complication, pancreatitis, and bleeding; (10) needle size; and (11) location from where the sample was obtained. Two authors (H.K. and G.J.C.) also independently assessed methodological quality using the Quality Assessment of Diagnostic Accuracy Studies 2 (QUADAS-2) tool [11]. Any disagreement was discussed and solved by a third reviewer (J.S.C.).
Data analysis
To evaluate the diagnostic performance, we constructed 2 × 2 tables. The TP, FP, TN, and FN values were analyzed to calculate sensitivity and specificity. The Mantel-Haenszel method of the random-effect model was used to calculate pooled sensitivity and specificity with corresponding 95% confidence intervals (CI), and pooled diagnostic odds ratio (DOR) using the DerSimonian-Laird method [12].
The formula for a positive likelihood ratio (LR) is sensitivity / (1-specificity), and the formula for a negative LR is (1-sensitivity) / specificity. A DOR can be calculated as the ratio of the odds of positivity in a disease state relative to the odds of positivity in the nondisease state. The value of the DOR ranges from zero to infinity, with higher values indicative of better discriminative performance. A value of 1 indicates that the test does not discriminate between people with and without the disease/condition [13].
We used summary receiver operating characteristic (SROC) curves to estimate the area under the curve (AUC). The closer the value of the AUC is to 1, the better validated the diagnostic test is. Furthermore, we used a Q* point from the SROC curve to obtain the maximal joint sensitivity and specificity. The Q* point is the intersection between a symmetrical SROC curve and the antidiagonal line, at which sensitivity equals specificity. Comparing this with other parameters, Q* point is a single-number summarizing the test performance and has the advantage of being less affected by heterogeneity [14,15].
For existence of technical failure, overall complication, pancreatitis, and bleeding we calculated pooled risk ratio (RR) and 95% CI. If the 95% CI included a value of 1, we considered the difference not to be statistically significant. We used the chi-square test and the I-squared test for heterogeneity. A level of 10% significance (p < 0.10) for the chi-square statistic or an I2 greater than 50% was considered to indicate considerable heterogeneity. The Mantel-Haenszel random-effect model was used for these studies, whereas the Mantel-Haenszel fixed model was used for studies that did not demonstrate significant heterogeneity [16]. If substantial heterogeneity was found, the meta-regression technique was used to explore the reasons for the heterogeneity. Meta-regression was performed using a generalization of Littenberg and Moses Linear models. The model was weighted by the inverse of the variance or study size [15].
We also conducted sensitivity analyses to evaluate the influence of individual studies from analyses with a heterogeneity of I2 greater than 50% of the overall effect estimate, by excluding one such study at a time from the analysis. For data expressed with median and interquartile ranges, we changed to mean and standard deviation via the data extraction method in the Cochrane handbook for systematic reviews of intervention [17].
Publication bias
Deek’s funnel plot asymmetry test was used to examine publication bias. Publication bias was conducted by a regression of InDOR against 1/root (effective sample size), with p < 0.05 for the slope coefficient indicating significant asymmetry [18].
Two-sided p < 0.05 was considered statistically significant. Analyses were performed using Meta-DiSc version 1.4 (Unit of Clinical Biostatistics, the Ramón y Cajal Hospital, Madrid, Spain) and Stata 14.0 (Stata Corp., College Station, TX, USA) software. We used the MedCalc Statistical Software version 13.0.2 (MedCalc Software, Ostend, Belgium; http://www.medcalc.org) to calculate the Z statistic of the SROC in order to compare the diagnostic accuracy of core and standard needles, with p < 0.05 indicating have statistical significance.
RESULTS
Study selection
The search of Ovid MEDLINE, EMBASE, and CENTRAL produced 22 studies, 20 from database searches and two from manual searching. Of these 22 studies, 11 studies were excluded because, after reviewing the title and abstracts, they appeared to be out of the remit of this study. Eleven studies were included in the final analysis. The literature search process is shown in Fig. 1.

Flow chart of literature search and selection.
Characteristics of included studies
Eleven studies involving 896 subjects met the defined inclusion criteria. Of the 896 patients, 792 were in the core needle group and 422 were in the standard needle group (both needles were used in 318 patients). The characteristics of the studies are summarized in Table 1. Seven studies were prospective [7,19-24], four were retrospective [25-28], and four were cross-over studies (three prospective cross-over [20,21,23] and one retrospective cross-over [26]). Seven studies only included the results from pancreatic biopsy [7,19,21-23,27,28], and four studies included overall results (including the pancreas) [20,24-26]. Seven studies compared the core needle with the standard needle [19-23,25,26], and four studies reported only the outcomes of core needle [7,24,27,28].
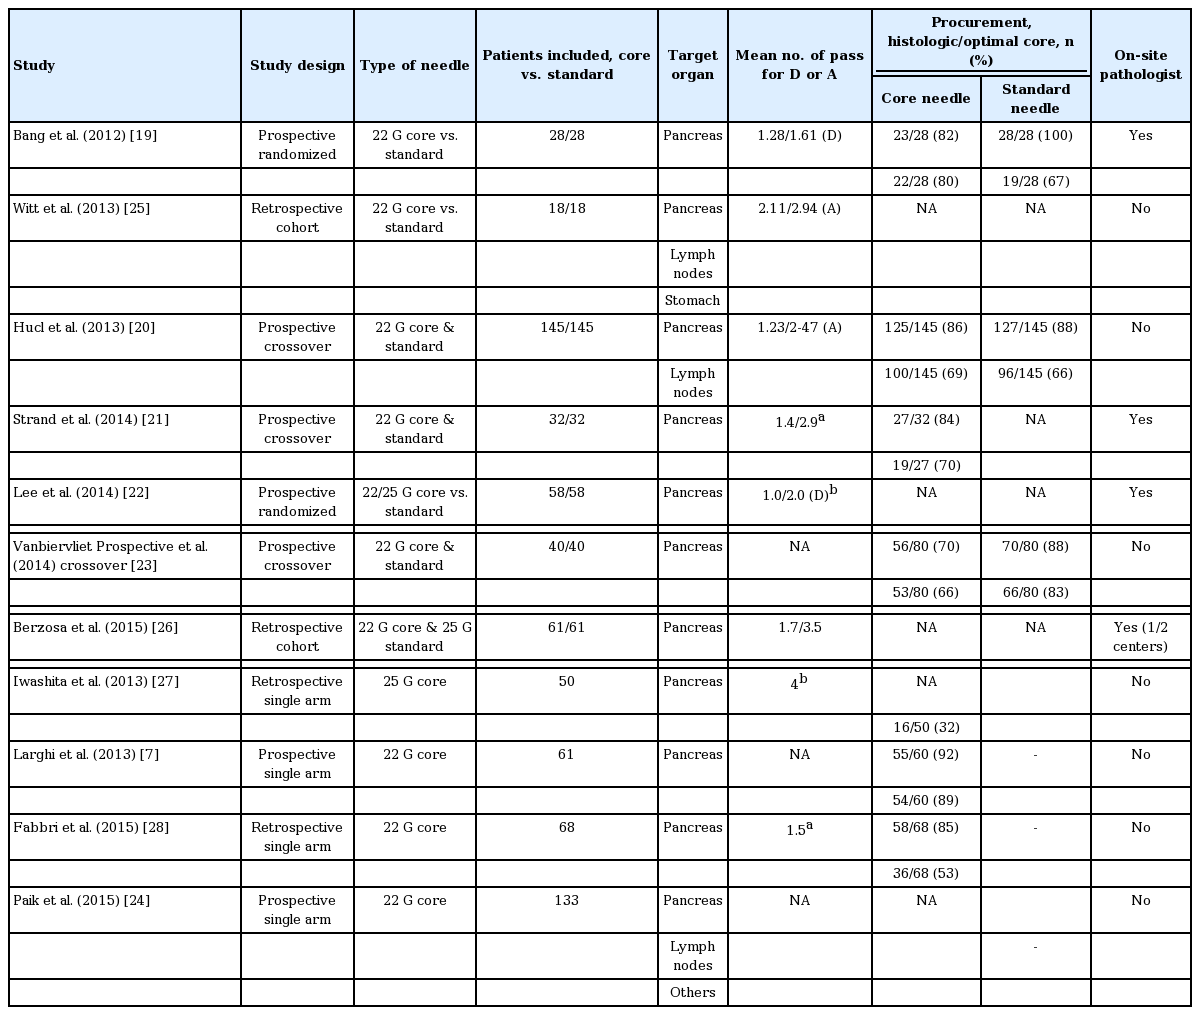
Summarized outcomes of studies included in the analysis
Quality of included studies
The quality was moderate in 11 studies, according to the QUADAS-2 items; the results for the distribution of the study design are shown in Appendix 1.
Diagnostic accuracy for all tissue
For the core needle, the pooled sensitivity and specificity of the diagnosis of malignancy were 0.88 (95% CI, 0.84 to 0.90; I2 = 81.7, pchi < 0.001) and 0.99 (95% CI, 0.96 to 1.00; I2 = 0.0, pchi = 0.651), respectively. The pooled LR+ and LR– were 16.32 (95% CI, 7.29 to 36.54; I2 = 0.0, pchi = 0.785) and 0.13 (95% CI, 0.08 to 0.22; I2 = 78.1, pchi < 0.001), respectively. The DOR was 167.37 (95% CI, 65.77 to 425.91; I2 = 0.0, pchi = 0.903) (Fig. 2).

Sensitivity, specificity, and diagnostic odd ratios of (A, B, C) the core and (D, E, F) standard needles for the diagnosis of malignancy. CI, confidence interval; OR, odds ratio.
Sensitivity and LR- showed considerable heterogeneity. In the study of Berzosa et al. [26], sensitivity was low compared with other studies. To exclude the effect of the results of Berzosa et al. [26], a sensitivity analysis was performed. After excluding the study of Berzosa et al. [26], sensitivity increased and heterogeneity decreased; however, it was still substantial; 0.90 (95% CI, 0.87 to 0.92; I2 = 68.2, pchi = 0.0026). Both pooled LR– and heterogeneity decreased (0.12; 95% CI, 0.08 to 0.17; I2 = 43.9, pchi = 0.0859).
For the standard needle, pooled sensitivity and specificity for the diagnosis of malignancy were 0.84 (95% CI, 0.79 to 0.88; I2 = 75.5, pchi = 0.003) and 1.00 (95% CI, 0.97 to 1.00; I2 = 0.0, pchi = 1.000), respectively. Pooled LR+ and LR– were 18.49 (95% CI, 5.61 to 60.95; I2 = 0.0, pchi = 0.4384) and 0.19 (95% CI, 0.12 to 0.30; I2 = 63.2, pchi = 0.028), respectively. The DOR was 130.14 (95% CI, 34.09 to 496.75; I2 = 0.0, pchi = 0.8071) (Fig. 2).
The AUC of the core and standard needles in the diagnosis of malignancy was 0.974 (standard error [SE] [AUC] = 0.011) and 0.955 (SE [AUC] = 0.029), respectively (Fig. 3). The Z statistic compared with these two SROC was 0.613 (p = 0.540).

Summary receiver operating characteristic (SROC) curves of (A) the core and (B) standard needles in the diagnosis of malignancy. AUC, area under the curve; SE, standard error.
A substantial degree of heterogeneity was observed in the sensitivity and pooled LR– for both groups. Since obvious heterogeneity was observed, the meta-regression technique was used to explore heterogeneity other than threshold effect; there were no significant factors (Table 2).

Meta-regression of potential sources of heterogeneity
Diagnostic accuracy for pancreatic tissue
For core needle, the pooled sensitivity and specificity for the diagnosis of pancreatic malignancy were 0.91 (95% CI, 0.88 to 0.94; I2 = 73.7, pchi = 0.002) and 0.97 (95% CI, 0.84 to 1.00; I2 = 0.0, pchi = 0.783), respectively. Pooled LR+ and LR– were 9.54 (95% CI, 3.53 to 25.81; I2 = 0.0, pchi = 1.000) and 0.10 (95% CI, 0.05 to 0.18; I2 = 59.6, pchi = 0.030), respectively. The DOR was 125.24 (95% CI, 36.95 to 424.41; I2 = 0.0, pchi = 0.976) (Fig. 4).

Sensitivity, specificity, and diagnostic odd ratio of (A, B, C) the core and (D, E, F) standard needles for the diagnosis of pancreatic malignancy. CI, confidence interval; OR, odds ratio.
In the study of Berzosa et al. [26], the sensitivity was too low. To exclude the effect of the results of this study, a sensitivity analysis was performed. Sensitivity increased and heterogeneity decreased; however, this still remained substantial (0.91; 95% CI, 0.88 to 0.94; I2 = 73.7, pchi = 0.0019). The heterogeneity of pooled LR– decreased, but was also still substantial (95% CI, 0.05 to 0.18; I2 = 59.6, pchi = 0.030).
For the standard needle, the pooled sensitivity and specificity for the diagnosis of pancreatic malignancy were 0.91 (95% CI, 0.85 to 0.95; I2 = 0.0, pchi = 0.416) and 1.00 (95% CI, 0.78 to 1.00; I2 = 0.0, pchi = 1.000), respectively. Pooled LR+ and LR– were 8.84 (95% CI, 1.96 to 39.90; I2 = 0.0, pchi = 0.769) and 0.12 (95% CI, 0.07 to 0.19; I2 = 0.0, pchi = 0.618), respectively. The DOR was 83.97 (95% CI, 14.04 to 502.29; I2 = 0.0, pchi = 0.848) (Fig. 4).
The AUC values of the core and standard needles in the diagnosis of pancreatic malignancy were 0.966 (SE [AUC] = 0.017) and 0.957 (SE [AUC] = 0.029), respectively (Fig. 5). The Z statistic compared with these two SROC was 0.238 (p = 0.789).

Summary receiver operating characteristic (SROC) curves of (A) the core and (B) standard needles in the diagnosis of pancreatic malignancy. AUC, area under the curve; SE, standard error.
Histologic core, adequacy, and number of passes for diagnosis
The procurement of a histologic core with the core needle was evaluated in four studies [7,19,23,28]. The probability for obtaining a histologic core was 0.828 (95% CI, 0.707 to 0.906; I2 = 72.26%, pchi = 0.013). The procurement of histologic cores with the core needle was compared with that of the standard needle in two studies [19,23]. Compared with the standard needle, the histologic core procurement of the core needle was significantly lower (RR, 0.81; 95% CI, 0.72 to 0.92; I2 = 0%, pchi = 0.810).
The procurement of an optimal core with the core needle was evaluated in seven studies [7,19-21,23,27,28]. The probability of obtaining an optimal core was 0.666 (95% CI, 0.530 to 0.779; I2 = 85.59%, pchi < 0.000). The procurement of an optimal core with the core needle was compared with that of the standard needle in three studies [19,20,23]. The combined results showed no evidence for a statistical difference (RR, 0.545; 95% CI, 0.187 to 1.589; I2 = 74.68%, pchi = 0.019).
Adequacy of sample with the core needle was compared with that of the standard needle in four studies [20,23,25,26]. The combined results indicated that there was no statistical difference (RR, 0.96; 95% CI, 0.90 to 1.02; I2 = 0%, pchi = 0.837).
The number of passes for diagnosis with the core needle was compared with that of the standard needle in two studies [19,22]. It was significantly lower with the core needle compared with the standard needle (standardized mean difference –0.72; 95% CI, –1.02 to –0.41; I2 = 30.0%, pchi = 0.232).
Technical failure
Technical failure with the core needle was compared with that of the standard needle in four studies [19,21-23]. The combined results showed no statistical difference (RR, 5.07; 95% CI, 0.68 to 37.63; I2 = 0%, pchi = 0.864).
Overall complications with the core needle were compared with that of the standard needle in six studies [19,20,22,23,25,26]. The combined results showed no evidence of a statistical difference (RR, 1.26; 95% CI, 0.34 to 4.62; I2 = 0%, pchi = 0.878). Pancreatitis and bleeding with core needle were compared with that of the standard needle in five [19,20,22,25,26] and two studies [22,23], respectively. The combined results did not show a statistical difference (RR, 1.35; 95% CI, 0.26 to 7.10; I2 = 0%, pchi = 0.987) and (RR, 1.30; 95% CI, 0.15 to 11.05; I2 = 53.17%, pchi = 0.144, respectively).
Publication bias
The p value for the slope coefficient in Deek’s funnel plot asymmetry test was 0.797, suggesting a low likelihood of publication bias (Appendix 2).
DISCUSSION
This systematic review and meta-analysis included a large cohort of patients (n = 896) and quantitatively summarized the available evidence regarding the outcomes with the core needle in comparison with the standard needle. This study demonstrated that the diagnostic outcomes, including accuracy for diagnosis of malignancy and adequacy of sample, were comparable between core and standard needles and there was no significant difference in procurement of optimal histologic cores between the core and standard needles.
The anticipated advantage of the core needle is the obtainment of core tissue for histopathologic diagnosis and an increase in the diagnostic accuracy. However, the procurement of core tissue was significantly lower with the core needle compared with the standard needle. There was no significant difference in the procurement of optimal cores between both needles. The procurement of optimal core tissue appeared to vary according to the needle caliber; 32% with 25 G core needle [27], 53% to 89% with 22 G core needle [7,19-21,23,28], and 90% with 19 G core needle [6]. In the study, with the lowest rate of 32%, capillary sampling with the stylet slow-pull technique by 25 G core needle was adopted [27]. It was assumed that the small caliber (25 G) of core needle, rather than the application of suction, was associated with the low procurement of core tissue [27]. On the other hand, the presence of tissue trap in the core needle may prevent the full application of capillary suction within the needle. Even though reverse bevel may increase the shearing of tissue from the mass, the sheared tissue may not be efficiently entrapped and piled up within the needle, and this may result in a lower procurement of core tissue. With the standard needle, a small caliber and application of low or no negative suction tends to produce less bloody specimens and improves the cytologic yield [29,30]. However, there was no significant difference in the procurement rate of core tissue between the application of high negative suction and the capillary sampling method with the core needle (85% and 92% [9,10] vs. 89% [24]).
The presence of whitish materials in specimens obtained by a 19 G standard needle has been used as an indicator for adequacy of sample, and a high correlation of these visible cores with adequate histologic cores has been reported [31,32]. However, a distinct discrepancy between visible cores and histologic cores (92% vs. 32%) has been reported with the 25 G core needle; this is assumed to be due to the smaller needle [27].
The optimal number of needle passes with the standard needle to obtain a correct diagnosis of pancreatic lesions has been reported as seven passes, with a sensitivity of 83% [33]. Core needle sampling allows both cytologic and histologic analysis. Combined diagnostic yield would likely reduce the number of needle passes for diagnosis. In the present study, the number of needle passes for diagnosis was significantly lower with the core needle than the standard needle. The sensitivity for combined cytologic and histologic analysis reached 82% to 85% for a single pass and 89% to 96% for multiple passes [24,27]. A distinctive advantage of the core needle might be the higher cost-effectiveness of performing a single pass, while maintaining sufficient diagnostic accuracy. However, as a single pass is not always sufficient for the correct diagnosis, multiple passes or waiting for interpretation after one pass is required. In addition, there is no clear advantage of one or two passes with core needle over three passes with standard needle. Three passes using a 25 G standard needle is faster, easier and less traumatic than two passes with a large core needle.
Even though the technical success rate of puncturing from the duodenum with the 19 G core needle was relatively high in one study (94%) [6], the bended endoscope position in the duodenum impairs its proper function. For this lesion, new 22/25 G core needle platforms have been developed and evaluated for their feasibility and diagnostic efficacy. Technical failure of the core needle was described in seven cases from three studies [19,21,27], and occurred in six cases during the transduodenal approach. In the comparison of both needles, there was significant difference in technical failure with the 22/25 G needle. For the transduodenal approach, the core needle needed to be pushed out of the echoendoscope in the stomach before advancing into the duodenum [6].
One of the important indication for doing core biopsy is to get more tissue for histologic evaluation of architecture. Nowadays, the need for enough sample for genetic testing is increasing. The problem with the published studies is that they do not provide a clear measurement of how much tissue was obtained for which test (for example, genetic testing or counting mitotic figures in gastrointestinal stromal tumor).
There were some limitations in this review. First, there was substantial heterogeneity in the selected studies. Despite reductions in heterogeneity after subgroup and sensitivity analysis, it remained substantial and its cause could not be determined. Variations in basic characteristics of selected studies, including defined criteria for adequacy of sample and histologic cores, and availability of on-site pathologist, may have potentially introduced heterogeneity. Second, to include as many eligible studies as possible and to exclude the language bias in this systematic review, the authors did not apply any language restrictions while searching the database. However, all selected studies were published in English. There may have been some other language publications that are not included in this review. Although publication bias was determined to be low by statistical analysis, the possibility of publication bias may not be fully excluded.
In conclusion, core and standard needles were comparable in terms of diagnostic accuracy, technical performance and safety profile. The number of needle passes for diagnosis was significantly lower with the core needle than the standard needle. However, there was no significant difference in the procurement of optimal histologic cores between both needles. Therefore, if the aim is to confirm a malignancy, either core or standard needles can be used based on endosonographer preference.
KEY MESSAGE
1. Core and standard needles were comparable in terms of diagnostic accuracy.
2. The number of needle passes for diagnosis was significantly lower with the core needle.
3. There was no significant difference in the procurement of optimal histologic cores between core and standard needles.
Notes
No potential conflict of interest relevant to this article was reported.