Blood count parameters can predict the severity of coronary artery disease
Article information
Abstract
Background/Aims
Because of the inflammatory nature of coronary artery disease (CAD), both platelets and white blood cells have been investigated for years. The aim of this study was to investigate the relationships between some prominently hematologic blood count parameters (mean platelet volume [MPV], neutrophil to lymphocyte ratio [NLR]) and the severity of CAD by using Gensini scores.
Methods
A total of 194 patients, who had undergone coronary angiography, enrolled in this study. The control group consisted of 42 patients who had normal coronary arteries. Remaining CAD patients were divided into two groups according to their Gensini scores.
Results
NLR and MPV were higher in the severe atherosclerosis group compared with the mild atherosclerosis group (p = 0.007, p = 0.005, respectively). The Gensini score showed significant correlations with NLR (r = 0.20, p = 0.011), MPV (r = 0.23, p = 0.004) and high density lipoprotein cholesterol (r = –0.161, p = 0.047). Using a cut-off level of 2.54, NLR predicted severe atherosclerosis with a sensitivity of 74% and specificity of 53% (area under curve [AUC], 0.627; 95% confidence interval [CI], 0.545 to 0.704; p = 0.004). MPV values above 10.4 predicted severe atherosclerosis with a sensitivity of 39% and specificity of 90% (AUC, 0.631; 95% CI, 0.549 to 0.708; p = 0.003). In the multiple logistic regression analysis, high levels of NLR (odds ratio [OR], 1.450; 95% CI, 1.080 to 1.945; p = 0.013) and MPV (OR, 1.622; 95% CI, 1.147 to 2.295; p = 0.006) were found to be independent predictors of severe atherosclerosis.
Conclusions
Our study suggests that both NLR and MPV are predictors of severe atherosclerosis and may be used for the prediction and identification of cardiac risks in CAD patients.
INTRODUCTION
Coronary artery disease (CAD) is the leading cause of death worldwide. CAD is an inflammatory, progressive disease and atherosclerosis has a pivotal role in the etiology [1]. It is already known that platelets and white blood cells (WBC) express and secrete inflammatory mediators. Because of the inflammatory nature of CAD, both platelets and WBCs have been investigated by many studies for years. WBCs and their subtypes were proven to be inflammatory markers in cardiovascular events [2,3]. Higher band neutrophil counts were related to increased atherosclerosis severity in coronary arteries [4]. Moreover, several studies have recently suggested the neutrophil to lymphocyte ratio (NLR) as a new inflammatory biomarker for vascular risks and cardiac mortality [5-7]. The relationship between CAD and NLR has been investigated by many studies, but only limited data exists for the association of NLR with extensive and severe level of CAD. Furthermore, since it has been discovered that platelets have an important role in the initiation and extension of CAD, appreciable interest has been directed toward platelets [8]. Large platelets are more active in terms of enzymatic and metabolic efficacy and have high thrombotic potential. Mean platelet volume (MPV) is an indicator of large platelets and platelet activation [9]. MPV has been shown to be increased in some cardiovascular events, like unstable angina and myocardial infarction [10,11]. But studies about the relationship between MPV and the severity of CAD have suggested conflicting evidence.
The prognostic situation of the CAD patients is closely related to the severity of atherosclerosis [12]. In this regard, the prediction and identification of severe atherosclerosis takes up a large share in the clinical practice of CAD patients. In accordance with this idea, we investigated the relationships between NLR, MPV and the severity of CAD by using Gensini scores (GS).
METHODS
Study population
We consecutively enrolled a total of 194 patients who were admitted to Adnan Menderes University Hospital for coronary angiography procedures between January 2013 and January 2014. All patients had anginal symptoms and/or positive myocardial perfusion scintigraphy or stress test results, or some electrocardiographic changes pointing to ischemia. Acute coronary syndrome history (less than 1 month), recent coronary intervention, heart failure, valvular heart diseases, the existence of inflammatory diseases, severe renal and hepatic diseases, active malignancy, malnutrition and pregnancy were all exclusion criteria. Patients with arterial blood pressure measurements above 140/90 mmHg or a history of current antihypertensive drug use were considered hypertensive. The presence of diabetes mellitus (DM) was defined as fasting plasma glucose (FPG) above 126 mg/dL or a history of actual antidiabetic drug use. The study was approved by the Local Ethics Committee and informed consent was received from all patients before coronary intervention.
Baseline variables
Before the procedure, baseline demographic and clinical data like age, gender, weight, the presence of chronic diseases (DM, hypertension, etc.), complete blood count parameters, FPG, lipid parameters, and serum creatinine were all obtained from the medical records of the patients. Hemoglobin, WBC, platelet, MPV, lymphocyte, and neutrophil counts were all measured with an auto-analyzer (Sysmex XE-2100, Sysmex, Kobe, Japan). NLR was calculated by dividing the neutrophil count with the lymphocyte count. The estimated glomerular filtration rate (eGFR) was calculated by using the simplified Modification of Diet in Renal Disease equation [13].
Coronary angiography and severity of coronary atherosclerosis
The Judkins technique was used for the coronary angiography. All angiography results were evaluated by two experienced cardiologists who did not have clinical knowledge about the patients. The presence of at least 50% luminal atheromatous stenosis in at least one coronary artery was considered as CAD [14]. Patients with normal coronary arteries were considered as the control group.
The severity of the CAD was evaluated using angiographic GS [15]. GS is a highly accepted scoring system for evaluating the coronary atherosclerotic burden. In this scoring system, grading is primarily done according to the narrowing of the lumen of the coronary arteries. For 1% to 25% lumen stenosis 1 point is given, 26% to 50% lumen stenosis 2 points, 51% to 75% lumen stenosis 4 points, 76% to 90% lumen stenosis 8 points, 91% to 99% lumen stenosis 16 points and for complete stenosis 32 points. The obtained scores are then multiplied by coefficients representing the importance of the coronary vessel and the segment in which stenosis is present. For the left main coronary artery a coefficient of 5 is used, for the left anterior descending and proximal part of the circumflex coronary artery a coefficient of 2.5 is used and for the proximal right coronary artery a coefficient of 1 is used. Similar coefficients are used for different localizations of the vessels. To obtain the total GS of a patient, the score found for each luminal stenosis and the coefficients are added.
After the examination of the patients’ medical records, GS was calculated separately for each patient meeting the inclusion criteria. Normal coronary arteries were observed in 42 patients’ coronary angiographies (control group). The remaining 152 patients had coronary luminal stenosis (CAD group). The CAD group was divided into two groups according to the severity of atherosclerosis as determined by the GS score. Patients who had GS scores between 1 to 29 were defined as the mild atherosclerosis group (n = 70), and the patients who had GS scores ≥ 30 were defined as the severe atherosclerosis group (n = 82) [16].
Statistical analysis
The major parameters of MPV and NLR were analyzed separately. We set α to 0.01 in a one-way analysis of variance power analysis and when the experimental power was above 90%, we terminated the study. According to this, the experimental power for each group (control, mild atherosclerosis, and severe atherosclerosis) with the current patient numbers was enough for the study to have > 90% power. In the study of Kaya et al. [17], a total of 172 patients enrolled and 46 of them constituted the control group. A similar study about the relationship between the NLR and CAD included a total of 175 patients, of which 69 were control group patients with normal coronary arteries [18]. All data was analyzed by using the PASW version 18 (SPSS Inc., Chicago, IL, USA). The normality of the numeric variables was assessed with the Kolmogorov-Smirnov test. The continuous and categorical variables were defined as mean ± standard deviation or median and percentages (%), respectively. The normally distributed numeric variables were compared with an independent sample t test. A chi-square test was used to compare categorical variables. The numeric variables that were not normally distributed were compared with the Mann-Whitney U test. The Kruskal-Wallis test was used to compare the three different groups. Correlation statistics were performed by using the Spearman rank test. A receiver-operating characteristic (ROC) curve analysis was used to determine the optimal cut-off values of both MPV and NLR to predict the presence of severe CAD. A multivariate logistic regression analysis was used to evaluate the independent predictors of severe atherosclerosis. All variables showing significant values less than 0.1 in the univariate analysis (age, sex, DM, high density lipoprotein cholesterol [HDL-C], FPG, WBC, neutrophil, platelet, MPV, and NLR) that were statistically significant in the correlation analysis were included in the multivariate analysis. The significance of all tests was two-tailed and statistical significance was defined as a p value of less than 0.05.
RESULTS
Baseline characteristics
A total of 194 patients (31% women and 69% men) were enrolled in this study. The study population consisted of 42 control group patients (mean age 57 ± 11) with normal coronary arteries and 152 patients (mean age 64 ± 10) with coronary stenosis. The clinical characteristics and the hematological and biochemical parameters of both patient groups are presented in Table 1. There was no statistically significant difference between these groups in terms of low density lipoprotein cholesterol (LDL-C) levels, hemoglobin, WBC, neutrophil and platelet counts, and the presence of hypertension. But in the CAD group, DM was more frequent and the patients were older. Patients with CAD had significantly higher NLR values (median, 2.02 [interquartile range (IQR), 1.62 to 2.21] vs. median, 2.69 [IQR, 2.17 to 3.52], p < 0.001). Fasting glucose (p = 0.004) and serum creatinine (p = 0.001) were significantly higher in patients with CAD, whereas HDL-C (p < 0.001) and eGFR (p = 0.030) were lower than in the controls. In the CAD group, 50 patients (33%) had coronary stent implantations, 28 patients (18%) had coronary bypass indications and 74 patients (49%) had medical treatment decisions after coronary intervention.
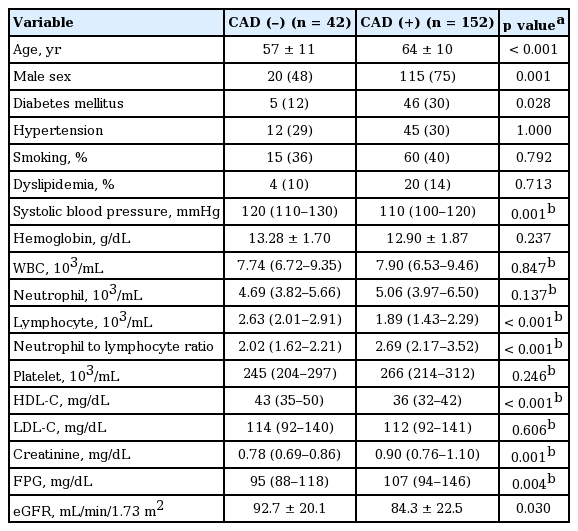
Baseline charecteristics of control and coronary artery disease group
The severity of CAD
The CAD group was divided into two groups according to their GS: mild atherosclerosis (GS 1 to 29) and severe atherosclerosis (GS ≥ 30) (Table 2). According to age, gender, the presence of hypertension, hemoglobin, neutrophil, lymphocyte count, serum creatinine, HDL-C, and LDL-C levels, there was no difference between groups. The group that had higher GS tended to have DM more frequently and also had significantly higher FPG (p = 0.020), WBC counts (p = 0.047), and platelet counts (p = 0.010).

Baseline characteristics of gensini score groups
Those in the severe atherosclerosis group had significantly higher NLR values (median, 2.87 [IQR, 2.52 to 3.56]) when compared with the mild atherosclerosis group (median, 2.53 [IQR, 1.92 to 3.42]; p = 0.010) and the control group (median, 2.02 [IQR, 1.62 to 2.21]; p < 0.001) (Fig. 1). MPV was significantly higher in the severe atherosclerosis group (median, 9.70 [IQR, 8.90 to 10.6]) compared with the mild atherosclerosis group (median, 9.25 [IQR, 8.70 to 9.92]; p = 0.010).
Neutrophil to lymphocyte ratio (NLR) in members of the control, mild, and severe atherosclerosis groups.
aAnalysis of variance test.
The GS had statistically significant correlations with NLR (r = 0.20, p = 0.011), MPV (r = 0.23, p = 0.004) and HDL (r = –0.161, p = 0.047). The statistically significant variables in the correlation analysis were assessed by a multiple logistic regression analysis to determine the independent predictors. In the multiple logistic regression analysis, high levels of NLR (odds ratio [OR], 1.450; 95% confidence interval [CI], 1.080 to 1.945; p = 0.013) and MPV (OR, 1.622; 95% CI, 1.147 to 2.295; p = 0.006) were revealed as independent predictors of severe atherosclerosis (Table 3).

Predictors of severe atherosclerosis in multivariate logistic regression analysis
In the ROC curve analysis, it was revealed that using a cut-off level of 2.54, NLR predicted severe atherosclerosis with a sensitivity of 74% and specificity of 53% (area under curve [AUC], 0.627; 95% CI, 0.545 to 0.704; p = 0.004). In addition, MPV levels above 10.4 demonstrated a sensitivity of 39% and specificity of 90% (AUC, 0.631; 95% CI, 0.549 to 0.708; p = 0.003) for the prediction of severe atherosclerosis (Fig. 2).

Diagnostic accuracy of neutrophil to lymphocyte ratio (NLR) and mean platelet volume (MPV) in prediction of coronary artery disease. AUC, area under curve.
DISCUSSION
In this study we revealed that NLR and MPV are independently associated with the presence and severity of CAD. Our study showed that a cut-off value of NLR above 2.54 and a value of MPV above 10.4 can predict the presence of an atherosclerotic process before coronary angiography with quite satisfactory sensitivity and specificity.
Inflammation has an important role in the evolution of atherosclerosis, and WBC count is a proven biomarker of inflammation. WBC has a pivotal role from the initiation to the progression phases of atherosclerosis [19]. Recently, numerous studies have demonstrated that a higher leucocyte count is an independent predictor of upcoming cardiovascular events [20]. Moreover, the relationship between WBC count and CAD severity has been shown by Ates et al. [21]. In a few previous studies, decreased lymphocyte counts were assessed as risk indicators of future cardiovascular events [10,22]. In our study, NLR incorporated the predictive efficacy of two different WBC subtypes into a single, readily available and easy calculable risk factor.
Papa et al. [6] demonstrated NLR as an independent predictor of cardiac mortality and adverse cardiac events in stable CAD patients. The same clinical evidence has been found in acute coronary syndrome patients [7,23]. Some recent studies revealed the role of NLR as an independent predictor of mortality in coronary intervention planned patients and as a predictor of survival in patients after coronary artery bypass grafting [5,24]. Similar to our study, Kalay et al. [25] studied the effects of hematologic parameters on the angiographic process of atherosclerosis and found NLR to be a predictor of the progression of atherosclerosis in coronary arteries.
The WBC counts were found to be statistically different (p = 0.047) between the groups classified according to GS in our study. In addition, higher levels of the baseline NLR measurement were revealed as an independent predictor of the severity of CAD. The association between inflammatory markers and the extent of the severity of CAD has been known for a long time [26]. Under these circumstances, the association between high levels of WBC count, the consequential high levels of NLR and severe CAD can be defined by the inflammatory constitution of coronary artery involvement.
Contrary to some prior studies, MPV was defined as a predictor of severe atherosclerosis in our study [27,28]. Patients with higher MPV levels had high GS and had more severe and critical lesions concurrently. Additionally, a correlation (p = 0.010) between platelet count and the severity of CAD was observed in this study, in contrast to previous studies [29,30]. The relationship between elevated MPV, platelet counts and the severity of atherosclerosis might be explained by the increase in the metabolic and enzymatic activation of platelets and the increased secretion of mediators from the hemostatically active and larger platelets. In the progression of atherosclerotic lesions, platelets are involved with chemotactic proteins, growth factors and inflammatory and mitogenic factors [31,32]. More severe CAD cause the increasing generation of larger platelets with higher MPV from bone marrow. And the large and high amounts of platelets may form atherosclerotic plaques and may lead to the progression of atherosclerosis.
Some complete blood count parameters are proven inflammatory biomarkers that predict adverse cardiovascular events. Our results show that increased NLR, as an inflammatory biomarker, contributes to the development of atherosclerosis from initiation through progression. In addition to this, an increased count of platelets with high MPV values furthers the progression of atherosclerotic plaque. This study supports the proven roles of WBC subtypes and platelets in the formation and propagation of atherosclerotic plaque.
The selection of patients from only one hospital may raise a limitation. Additionally, the assessment of the severity of CAD was performed by coronary angiography. Dual-source multi-slice computed tomographic coronary angiography or intravascular ultrasound may be more sensitive in the assessment of the severity of CAD. The other limitation was that we did not measure the synchronous inflammatory biomarkers of the patients.
In conclusion, this study revealed the independent predictor roles of both NLR and MPV for the severity of CAD. NLR and MPV are readily available, easy calculable and low priced parameters, unlike other inflammatory markers. Both may be easily used in predicting the severity of CAD before coronary interventions.
KEY MESSAGE
1. Neutrophil to lymphocyte ratio (NLR) was found to be an independent predictor of severe atherosclerosis.
2. Mean platelet volume (MPV) was found to be an independent predictor of severe atherosclerosis.
3. Cut-off value of NLR above 2.54 and a value of MPV above 10.4 can predict the presence of atherosclerosis before coronary angiography.
4. Both NLR and MPV may be used in daily practice for the prediction and identification of cardiac risks without an intervention.
Notes
No potential conflict of interest relevant to this article was reported.
Acknowledgements
We want to thank Associate Professor Imran Kurt Omurlu for her important contributions to the statistical analysis of this study.