Interatrial septal thickness as a marker of structural and functional remodeling of the left atrium in patients with atrial fibrillation
Article information
Abstract
Background/Aims:
There have been reports that interatrial septal (IAS) thickness is increased in patients with atrial fibrillation (AF). This study was performed to investigate whether IAS thickness determined by transthoracic echocardiography (TTE) represents the amount of left atrium (LA) structural and functional remodeling.
Methods:
The study population consisted of 104 consecutive patients who underwent catheter ablation (CA) for AF (paroxysmal atrial fibrillation [PAF], 82; persistent atrial fibrillation [PeAF], 22). IAS thickness and left atrium volume (LAV) using TTE, and LA voltage (LAVOL) using 3-dimensional electroanatomical mapping system were assessed during sinus rhythm.
Results:
IAS thickness was significantly correlated with maximal LAV (LAVmax) (r = 0.288, p = 0.003), mean LAVOL (r = –0.537, p < 0.001), total left atrium emptying fraction (LAEFtotal; r = –0.213, p = 0.030), and active LAEF (LAEFactive; r = –0.249, p = 0.014). IAS thickness was greater in the high-risk group (≥ 2) compared to other groups according to CHA2DS2-VASc score (p = 0.019). During a follow-up of 19.6 months, 23 subjects (22.1%; PAF, 17; PeAF, 6) had recurrence of arrhythmia. Univariate analysis showed that LAVmax, minimal LAV, mean LAVOL, LVEFtotal, LVEFactive, and IAS thickness were associated with recurrence of arrhythmia. However, on multivariate analysis, only mean LAVOL and LAEFactive were independent risk factors for recurrence.
Conclusions:
Although IAS thickness showed significant correlations with parameters for LA structural and functional remodeling, this parameter alone could not independently predict recurrence of arrhythmia after CA for AF.
INTRODUCTION
Atrial fibrillation (AF) is a major risk factor for ischemic stroke and is associated with increased morbidity and mortality [1]. Although catheter ablation (CA) for AF has emerged as an effective and curative treatment option [2,3], a substantial proportion of patients experience recurrence of arrhythmia after AF ablation [4,5].
Previous studies have indicated that structural remodeling of the left atrium (LA), such as atrial fibrosis as well as enlarged left atrium volume (LAV), is an independent risk factor for predicting AF recurrence after CA [6-8]. The amount of LA scarring measured by three-dimensional (3D) voltage mapping is a powerful independent predictor of procedural outcome after CA [6]. Recent studies have suggested that delayed-enhancement magnetic resonance imaging (DE-MRI) may be a useful noninvasive modality to assess the amount of LA fibrosis, and to predict functional remodeling of LA and recurrence rate after AF ablation [7,9]. However, DE-MRI is not routinely available outside of research facilities. Therefore, more widely available and more reproducible noninvasive imaging techniques should be investigated for use in clinical practice.
There have been reports that interatrial septal (IAS) thickness was increased in patients with AF [10,11]. Moreover, we reported previously that IAS thickness was associated with amount of epicardial adipose tissue (EAT), which may be related to atrial arrhythmogenicity [12]. The present study was performed to determine whether IAS thickness is a simple, noninvasive imaging parameter that can be used to represent the degree of LA remodeling and to examine whether it may predict procedural outcome after CA in patients with AF.
METHODS
Study sample
A total of 242 consecutive patients scheduled to undergo CA for AF at Korea University Cardiovascular Center between November 2009 and October 2010 were enrolled in this study. All enrolled subjects underwent transthoracic echocardiography (TTE), multi-slice computed tomography (MSCT), and contact LA voltage (LAVOL) mapping using a 3D electroanatomical mapping system (NavX, St. Jude Medical, Inc., Minneapolis, MN, USA) prior to CA on the same day. We excluded subjects who had AF at the time of echocardiographic examination and who required direct current (DC) cardioversion more than three times to restore sinus rhythm (SR) during LAVOL mapping. Other exclusion criteria were the presence of visible thrombi in LA on transesophageal echocardiography (TEE), previous AF ablation or cardiac surgery, aortic aneurysm or dissection, renal insufficiency, hyperthyroidism, electrolyte imbalance, alcohol abuse, malignancy, connective tissue disease, any acute or chronic inflammatory disease, and an implanted pacemaker or defibrillator. All antiarrhythmic drugs were discontinued at least five half-lives prior to examination. Amiodarone was discontinued ≥ 8 weeks earlier. AF subjects were subdivided into paroxysmal atrial fibrillation (PAF) or persistent atrial fibrillation (PeAF) according to the most recent guidelines of the Heart Rhythm Society and European Cardiac Arrhythmia Society [13]. Enrolled subjects were divided into three groups according to CHADS2 score (0, low risk; 1, intermediate risk; ≥ 2, high risk) and CHA2DS2-VASc score (0, low risk; 1, intermediate risk; ≥ 2, high risk). Each participant signed an informed consent form prior to enrollment in the study, which was approved by the Human Subjects Review Committee of Korea University Hospital. This study was registered as KCT0000079 at http://cris.nih.go.kr.
Transthoracic echocardiography
All subjects underwent two-dimensional, M-mode, Doppler, and tissue Doppler imaging echocardiography during SR. All examinations were performed using a commercially available Vivid 7 (GE Medical Systems, Vingmed, Horten, Norway) ultrasound system. All recorded echocardiograms were collected and analyzed using a computerized off-line analysis station (Echopa 6.3.4, GE Medical Systems).
All measurements were derived from three consecutive cardiac cycles and averaged. For each view, the transducer was carefully angled to quantitatively maximize atrial size, and gain positions were adjusted to obtain the clearest outline of the endocardium. Each echocardiographic parameter was determined according to the recommendations of the American Society of Echocardiography [14].
Interatrial septal thickness assessment
The maximal thickness of IAS was measured in apical four-chamber view after zooming in end-diastolic phase (Fig. 1A). To assess the tissue characteristics of IAS, the values of integrated backscatter (IBS) were obtained from the IAS and LA cavity in the apical four-chamber view by positioning the 5 × 5 mm sample volume at each site while measuring IAS thickness. As there is no pericardium in the IAS, the IBS reflectivity of IAS was calculated as the ratio between the IBS values of IAS and the LA cavity × 100. All IBS values were measured during the end-diastolic phase at the same phase of the cardiac cycle. IAS thickness was also measured by MSCT (Fig. 1B). MSCT images were acquired using a 64-channel CT scanner (Brilliance 64, Philips Healthcare, Cleveland, OH, USA). Imaging was performed during a single inspiratory breath hold, in the craniocaudal direction, in helical mode, with retrospective electrocardiographic (ECG) gating. Axial multiphase images were reconstructed (slice thickness, 0.8 mm; increment, 0.5 mm) using retrospective ECG gating.

(A, B) Representative images of interatrial septal (IAS) thickness measurement by transthoracic echocardiography (TTE) and multi-slice computed tomography (MSCT). The IAS thickness measured by TTE showed good correlations with (C) integrated backscatter (IBS) reflectivity of the IAS and (D) IAS thickness measured by MSCT.
LA function assessment
LA anteroposterior dimension was obtained in the parasternal long axis view to assess the diameter of the LA. LAV was determined with the modified Simpson’s method, as we reported previously [15]. To assess the LA phasic emptying fraction during the cardiac cycle, LAVs were measured at the mitral valve opening (maximal LAV, LAVmax), LAV at the onset of atrial emptying (LAVOAE, P wave onset of the electrocardiogram), and at mitral valve closure (minimal LAV, LAVmin) from the apical two- and four-chamber views. Detailed LA transport functions were calculated as follows:
Total LAEF (LAEFtotal) = 100 × (LAVmax – LAVmin) / LAVmax
Passive LAEF (LAEFpassive) = 100 × (LAVmax – LAVOAE) / LAVmax
Active LAEF (LAEFactive) = 100 × (LAVOAE – LAVmin) / LAVOAE
LAEF, left atrium emptying fraction.
Three-dimensional LA voltage mapping
TEE and MSCT were performed immediately prior to CA in all subjects. After double transseptal puncture, systemic anticoagulation was achieved via intravenous heparin to maintain an activated clotting time between 300 and 350 seconds. After determination of the 3D geometry of the LA and pulmonary veins (PVs) using the NavX mapping system and merging with volume-rendered MSCT imaging, we performed high-density 3D voltage mapping using an open-irrigation, 3.5-mm-tip deflectable catheter (Celsius, Biosense Webster, Diamond Bar, CA, USA). In cases in which AF occurred during 3D voltage mapping, internal DC cardioversion (5 to 15 J, biphasic shocks with R-wave synchronization, anodal decapolar catheter in the high right atrium to cathodal duodecapolar catheter inside the coronary sinus) (Lifepak 12, Physio-Control Ltd., Redmond, WA, USA) was conducted. Three-dimensional voltage maps were obtained during high right atrial pacing with a cycle length of 500 ms. To evaluate regional voltage and ensure uniform distribution, LA was divided into six segments (posterior, roof, anterior, lateral, septal, and inferior wall) and then peak-to-peak bipolar voltages were obtained at more than 20 points in each segment. The mean voltage was determined by averaging the bipolar voltage of the points within the given region. An average of 174.7 ± 24.0 points (range, 135 to 214) were collected in the LA. Voltage mapping was not conducted in patients with reinitiating AF requiring DC cardioversion more than three times during the mapping procedure.
Ablation procedures
All PVs were mapped with a decapolar circular catheter (Lasso, Biosense Webster). Radiofrequency energy was delivered at a maximum power output of 25 to 30 W, flow rate of 17 to 30 mL/min, and maximum temperature of 48°C. The endpoint for each individual application at a given site was either total voltage abatement or current application of up to 40 seconds with adequate tissue contact and power delivery. A stepwise ablation procedure was performed in all AF patients regardless of AF type. Initially, all patients underwent wide circumferential pulmonary vein isolation (CPVI). All ablated PVs were revisited after a waiting period of at least 30 minutes. PVs with evidence of reconnection were reisolated. For patients who remained in SR after CPVI, an inducibility test with 10 mA pacing was performed in the high right atrium or coronary sinus using a pacing cycle length of 180 ms with 1:1 capture. If induced AF was sustained for more than 10 minutes, additional ablation of the complex fractionated atrial electrogram (CFAE) sites on both atria was completed until AF termination was observed. CFAE was defined as electrograms with a fractionated interval between 50 and 120 ms, displayed by color map on the NavX geometry. For patients who remained in AF after CPVI, CFAE ablation on both atria was also performed until AF termination was observed. In cases where AF converted to organized atrial flutter (AFL), a local activation time map was created during stable AFL, and was displayed on the NavX geometries of the atria. Several rounds of radiofrequency energy were then delivered to the critical isthmus or foci until AFL termination was observed. In patients with PeAF and/or induced typical AFL, a cavotricuspid isthmus line was created and bidirectional block was confirmed by a differential pacing maneuver. If subjects remained in AF up to 5 hours after transseptal puncture, SR was restored by internal DC cardioversion under isoproterenol infusion (5 μg/min). The procedural endpoints were: (1) no immediate reinitiation of AF after DC cardioversion, and (2) noninducibility of sustained organized AFL.
Follow-up
If no complications arose during the procedures, subjects were started on warfarin anticoagulation therapy without any antiarrhythmic medications. All enrolled subjects were prospectively followed up for recurrence of AF after CA via monthly outpatient clinic visits. Subjects also underwent 48-hour Holter monitoring at 1, 3, 6, and 12 months post-CA. Electrocardiography was performed at each visit and any time the subjects reported palpitations. In addition, subjects were questioned by telephone by a nurse practitioner at 2-week intervals and were instructed to call whenever they experienced symptoms. If any instances of AF or AFL were documented during the follow-up period, the subject was diagnosed with clinical recurrence of arrhythmia and antiarrhythmic medications were prescribed.
Statistical analyses
All continuous variables are expressed as the mean ± standard deviation or median (interquartile range) depending on the distribution. For continuous data, the statistical significance of differences was evaluated using Student t test or Mann-Whitney U test depending on the data distribution. Categorical variables are presented as frequencies (percentage) and the chi-square test was used for analysis of categorical variables. All correlations were examined using Spearman rank correlation test. The statistical significance of each group was assessed using the Kruskal-Wallis test for the CHADS2 score group and oneway ANOVA for the CHA2DS2-VASc score group. To determine whether any of the variables were independently related to recurrence of arrhythmia after CA, multivariate analysis of variables with p < 0.05 on univariate analysis was performed using linear regression analysis. The area under the receiver operating characteristic (ROC) curve was used to evaluate the accuracy of prediction of recurrence, and then to derive sensitivity and specificity values for each cutoff value. Finally, to test the reproducibility of the IAS thickness measurement, inter- and intraobserver variability were analyzed. Bland-Altman analysis was performed to express reproducibility of measurements for IAS thickness between each investigator. All statistical analyses were conducted using SPSS version 13.0 (SPSS Inc., Chicago, IL, USA). Statistical significance was set at p < 0.05 (two-sided).
RESULTS
Of the initial total of 242 consecutive patients, 116 were excluded because they had AF at the time of TTE examination and 22 were excluded because they required DC cardioversion more than three times during LAVOL mapping. Therefore, a total of 104 subjects were enrolled in this study.
The baseline characteristics of all enrolled subjects are summarized in Table 1. The mean age was 53.5 ± 12.1 years, 79 subjects (76%) were male, 82 subjects had PAF, and 22 had PeAF. The mean CHADS2 score was 0.71 ± 0.89 and mean CHA2DS2-VASc score was 1.16 ± 1.12. Mean IAS thickness was 11.26 ± 2.02 mm. LAVmax was significantly greater and mean LAVOL was lower in the PeAF group than in the PAF group. The IBS reflectivity of IAS showed a positive correlation with IAS thickness (r = 0.476, p < 0.001) (Fig. 1C). Moreover, IAS thickness measured by TTE was closely correlated with that determined by MSCT (r = 0.705, p < 0.001) (Fig. 1D).
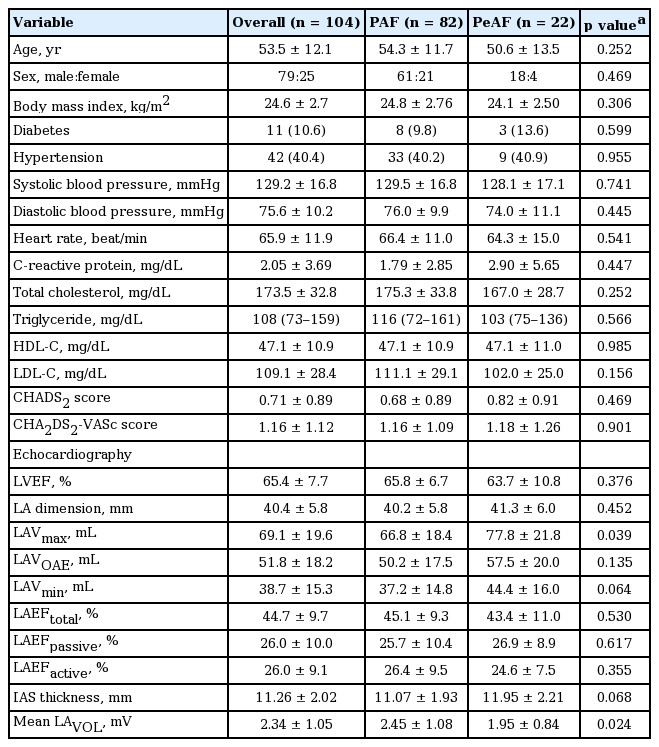
Baseline characteristics, echocardiographic measurements, and mean voltage of the left atrium
Mean LAVOL and septal LAVOL showed negative correlations with IAS thickness (r = –0.537, p < 0.001; r = –0.330, p = 0.001, respectively). In addition, mean LAVOL showed positive correlations with LAEFtotal and LAEFactive (r = 0.292, p = 0.003; r = 0.283, p = 0.005, respectively). IAS thickness was associated with LAVs and LAEFs (Fig. 2). It was also correlated with CHA2DS2-VASc score (r = 0.348, p < 0.001) and CHADS2 score (r = 0.208, p = 0.034). Fig. 3 shows a comparison of mean LAVOL and IAS thickness among three groups according to CHADS2 score (0, n = 52; 1, n = 36; ≥ 2, n = 16), and CHA2DS2-VASc score (0, n = 35; 1, n = 34; ≥ 2, n = 35). Mean LAVOL was much lower in the high-risk group than in the other groups according to CHADS2 score (p = 0.090) (Fig. 3A) and CHA2DS2-VASc score (p = 0.001) (Fig. 3B). IAS thickness was much greater in the high-risk group than the other groups according to CHADS2 score (p = 0.056) (Fig. 3C) and CHA2DS2-VASc score (p = 0.019) (Fig. 3D).

Relationships between interatrial septal (IAS) thickness and left atrial (LA) structural and functional parameters. (A) Linear regression between IAS thickness and mean LA voltage. (B) Linear regression between IAS thickness and maximal LAV (LAVmax). (C) Linear regression between IAS thickness and total left atrial emptying fraction (LAEFtotal). (D) Linear regression between IAS thickness and active LAEF (LAEFactive).
Mean left atrial voltage (LAVOL) and interatrial septal (IAS) thickness according to CHADS2 score and CHA2DS2-VASc score. (A, C) There were no statistically significant differences in mean LAVOL or IAS thickness according to CHADS2 score. (B, D) However, mean LAVOL was significantly lower and IAS thickness was significantly higher in high-risk CHA2DS2-VASc level (≥ 2).
The clinical and laboratory findings influencing AF recurrence are listed in Table 2. During the mean follow-up of 19.6 ± 4.1 months after a single ablation procedure, 23 subjects (22.1%; PAF, 17; PeAF, 6) had recurrence of arrhythmia. Univariate analysis showed that phasic LAVs, LAEFtotal, LAEFactive, IAS thickness, and mean LA-VOL were associated with AF recurrence. Multivariate analysis revealed that LAEFactive and mean LAVOL were independent risk factors for AF recurrence after CA.
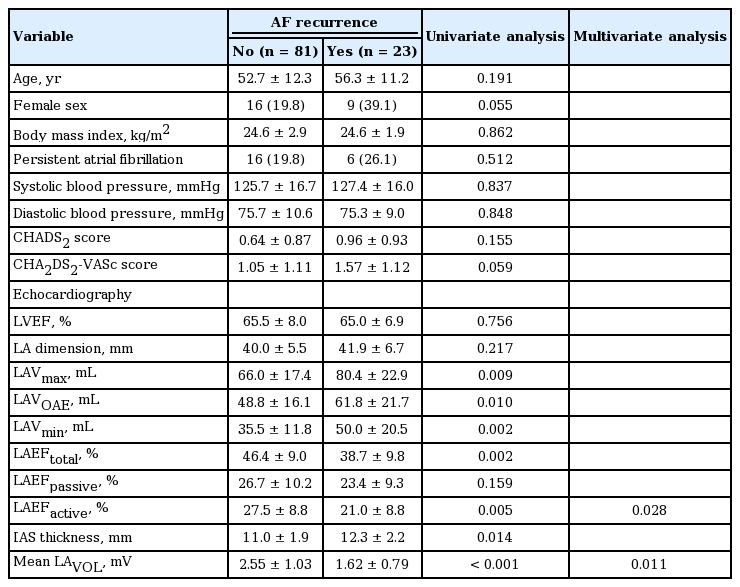
Binary logistic regression analysis: variables influencing arrhythmia recurrence after catheter ablation for AF
Fig. 4 shows the ROC curves for mean LAVOL and LAEFactive for prediction of AF recurrence. Mean LAVOL < 2.01 mV showed sensitivity of 73.9% and specificity was 71.6% (p < 0.001). Using a cutoff value of 23.5% in LAEFactive, the sensitivity and specificity were 66.7% and 63.6%, respectively (p = 0.003).
Receiver operator characteristic curves for (A) mean left atrial (LA) voltage and (B) active left atrial emptying fraction (LAEFactive) were used to distinguish subjects who are prone to recurrence of arrhythmia after atrial fibrillation ablation. AUC, area under the curve; CI, confidence interval.
Fig. 5 shows the reproducibility of IAS thickness measurement. The correlation of intraobserver measurements was excellent (r = 0.821, p < 0.001), and the correlation of interobserver measurements was good (r = 0.560, p = 0.001). The Bland-Altman plot showed excellent reproducibility of IAS thickness measurement between investigators.
(A-D) Intra- and interobserver reproducibility of interatrial septal (IAS) thickness on transthoracic echocardiography. The Bland-Altman plot shows the excellent reproducibility of IAS thickness measurement between investigators.
DISCUSSION
The most noteworthy findings of this study were: (1) IAS thickness measured by TTE correlated with the degree of structural remodeling (mean LAVOL and LAVs) and functional remodeling (LAEFtotal and LAEFactive) of the LA; (2) IAS thickness is associated with clinical surrogate parameters for LA remodeling, such as CHADS2 score and CHA2DS2-VASc score; and (3) IAS thickness, however, could not independently distinguish high-risk patients who are prone to recurrence of arrhythmia before the AF ablation procedure.
Preexisting LA scarring assessed by 3D voltage mapping is a reliable independent predictor of procedural outcome [6]. Recently, DE-MRI was suggested as being useful for quantitative assessment of LA fibrosis, and providing a noninvasive modality for predicting functional remodeling of LA and recurrence rate after AF ablation [7,9]. However, these approaches to assess the amount of LA scarring are extremely labor-intensive and time-consuming. In addition, these modalities are not routinely available outside research facilities. In this regard, the findings of the present study have potential clinical utility because IAS thickness can be easily, reproducibly, and accurately determined by TTE.
Several recent studies indicated that EAT is associated with the prevalence and chronicity of AF, independently of other traditional risk factors [16,17]. Several possible mechanisms are likely to account for the pathogenic relationship between EAT and AF, including electrical and structural remodeling of the atria via proinflammatory properties. We also demonstrated that periatrial EAT, as well as the total volume of EAT, are significantly larger in AF subjects, as compared to those of matched controls [12]. Moreover, IAS thickness measured by MSCT was independently associated with LAV in patients with AF. Previously, Lopez-Candales et al. [10,11] reported that IAS thickness measured by TTE and TEE was significantly increased in AF patients, and suggested that it might be a surrogate marker of changes in components within the atrial wall. As the posterior portion of IAS is essentially an extracardiac structure containing abundant adipose tissue [18-20], many investigators have suggested that atrial arrhythmia may be related to IAS thickness, and the mechanism of atrial arrhythmia may involve fatty tissue infiltration that interferes with the architecture of atrial myocytes [21-23].In the present study, we showed that IAS thickness assessed by TTE was significantly correlated with IBS reflectivity of IAS, suggesting that the main determinant of IAS was EAT. Furthermore, we demonstrated that IAS thickness measured by TTE was closely associated with mean LAVOL and LAV.
The CHADS2 score, which has been used as a guideline for the prevention of ischemic stroke in AF patients, may be a useful clinical surrogate parameter reflecting the degree of LA remodeling. Daccarett et al. [24] reported that higher CHADS2 score was associated with a greater degree of LA scarring detected by DE-MRI. Chao et al. [25] suggested that higher CHADS2 scores may predict procedural outcome after AF ablation. Recently, the European Society of Cardiology suggested new guidelines for AF management [26] and proposed a CHA2DS2-VASc score, which may be more accurate for determining the intermediate-risk group than CHADS2 score. Our findings support the hypothesis that the CHA2DS2-VASc score is more closely related to the degree of LA structural remodeling than the CHADS2 score. IAS thickness was also more closely associated with the CHA2DS2-VASc score than the CHADS2 score.
In the present study, we found that IAS thickness was significantly correlated with LAEFtotal and LAEFactive. As atrial mechanical contractile remodeling has generally been considered to be a major cause of thrombus formation in patients with AF [27-29], our findings suggest that IAS thickness may be a useful surrogate predictor of future thromboembolic risk in patients with AF. However, we cannot conclude that IAS thickness is an independent predictor for ischemic stroke because we did not investigate the occurrence rate of thromboembolic events in this study.
Finally, as a substantial number of patients experience recurrence of arrhythmia after AF ablation, assessment of the degree of LA structural and functional remodeling may be needed for patient selection prior to CA. From the this viewpoint, our findings are significant because IAS thickness allows identification of LA remodeling, but not high-risk patients who are prone to recurrence of arrhythmia after AF ablation. However, it could be assessed easily, noninvasively, and reproducibly as a means of determining LA remodeling. Therefore, IAS thickness may be a useful parameter for predicting the degree of LA structural and functional remodeling in patients with AF.
In limitations, first, we enrolled only highly selected patients with SR at the time of examination because LA-VOL mapping and LAEFactive should be assessed during SR. As we may have excluded patients with profound LA remodeling in this study, our results cannot be extrapolated to patients with long-lasting PeAF or permanent AF. Second, we cannot confirm that the main determinant of IAS was adipose tissue, although IAS thickness was positively correlated with IBS reflectivity and negatively correlated with septal LAVOL. Finally, it is not clear whether adipose tissue located in the IAS itself induces LA remodeling or whether the thickening of IAS is a consequence of the LA remodeling process caused by other factors. Therefore, further investigations are warranted to determine whether there is a causal relationship between IAS thickness and LA remodeling.
In conclusion, measurement of IAS thickness may be a reliable, noninvasive parameter for reflecting the degree of LA structural and functional remodeling. Furthermore, as IAS thickness was closely associated with CHA2DS2-VASc score, this measure may be applied to future thromboembolic risk stratification in patients with AF. However, it was not a useful parameter to identify patients who are prone to recurrence of arrhythmia after AF ablation.
KEY MESSAGE
1. Interatrial septal (IAS) thickness is correlated with the degree of left atrium structural and functional remodeling.
2. IAS thickness is also associated with CHADS2 and CHA2DS2-VASc score.
3. However, IAS thickness could not independently distinguish high-risk patients who are prone to recurrence of arrhythmia before the atrial fibrillation ablation procedure.
Notes
No potential conflict of interest relevant to this article was reported.
Acknowledgements
We thank Sung Bok Lee, Byung Jin Choi, Seok Man Mun, and Eun Hee Choi for their valuable contributions to this study. This study was supported by grants (MD11004, ED15037) of the Korea University Medical Center.