The Role of Optical Coherence Tomography in Coronary Intervention
Article information
Abstract
Optical coherence tomography (OCT) is an optical analog of intravascular ultrasound (IVUS) that can be used to examine the coronary arteries and has 10-fold higher resolution than IVUS. Based on polarization properties, OCT can differentiate tissue characteristics (fibrous, calcified, or lipid-rich plaque) and identify thin-cap fibroatheroma. Because of the strong attenuation of light by blood, OCT systems required the removal of blood during OCT examinations. A recently developed frequency-domain OCT system has a faster frame rate and pullback speed, making the OCT procedure more user-friendly and not requiring proximal balloon occlusion. During percutaneous coronary intervention (PCI), OCT can provide detailed information (dissection, tissue prolapse, thrombi, and incomplete stent apposition [ISA]). At follow-up examinations after stent implantation, stent strut coverage and ISA can be assessed. Several OCT studies have demonstrated delayed neointimal coverage following drug-eluting stent (DES) implantation vs. bare metal stent (BMS) placement. While newer DESs promote more favorable vascular healing, the clinical implications remain unknown. Recent OCT studies have provided insights into restenotic tissue characteristics; DES restenotic morphologies differ from those with BMSs. OCT is a novel, promising imaging modality; with more in-depth assessments of its use, it may impact clinical outcomes in patients with symptomatic coronary artery disease.
INTRODUCTION
Optical coherence tomography (OCT) is a method of obtaining tomographic images of a human organ based on the coherence of light. Around 1990, OCT was independently developed by two Japanese researchers, Naohiro Tanno of Yamagata University, Japan, and James G. Fujimoto of the Massachusetts Institute of Technology (MIT) in the United States, and patent applications were submitted at about the same time in Japan and the United States during 1991. In vitro observation of the retina and coronary artery was first performed in 1991 [1]. OCT was initially applied in the clinical setting in the ophthalmology field in 1996 and is now widely used to assess retinal diseases and other conditions.
In cardiology, OCT is an optical analog of intravascular ultrasound (IVUS), used to examine the coronary arteries. Ultrasound employed for IVUS examination is replaced by near-infrared light with a wavelength of about 1,300 nm, which is absorbed by red blood cells, water, lipids, and protein at relatively low levels. Through a rotating glass fiber-optic system, coherent infrared light can be directed and reflected within the tissue to create a detailed tissue image with extraordinarily high resolution, and IVUS-like cross-sectional tomographic images can be obtained. OCT and IVUS differ in several respects, as shown in Table 1. The resolution of OCT (to 10-20 µm) is about 10-fold higher than that of IVUS (to 100-150 µm), but the maximum depth of tissue penetration is lower with OCT (1-2 mm) than with IVUS (4-8 mm). Another important difference is related to the strong attenuation of light by blood, which originates from two sources: absorption by hemoglobin and scattering by red blood cells. To examine coronary arteries, blood must first be removed during an OCT examination to eliminate massive scattering of light by red blood cells.
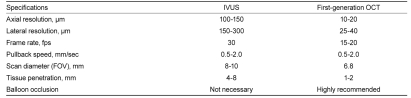
Comparison of IVUS and first-generation time-domain OCT
OCT SYSTEM AND TECHNIQUE
Time-domain OCT
The first clinically/commercially available OCT system in the cardiology field was produced by LightLab Imaging Inc. (Westford, MA, USA). The first-generation OCT (ImageWire and M2/3 OCT system; LightLab Imaging Inc.) incorporated both an OCT imaging wire and an over-the-wire occlusion balloon. First, a conventional 0.014" angioplasty guide wire is used to cross the lesion and an occlusion balloon is passed along the guide wire beyond the lesion. Then, the guide wire and the imaging wire are exchanged. To examine the lesion, the occlusion balloon is pulled back proximal to the lesion and then dilated at a low pressure to block blood flow. Blood is then removed by flushing with lactated Ringer's solution or normal saline. In our experience, symptoms and electrocardiographic changes often persist when normal saline is used for flushing. Thus, we recommend the use of lactated Ringer's solution. Advancing the occlusion balloon across a severe stenosis is occasionally difficult. In such cases, a skilled operator may cross an imaging wire alone across the severe stenosis, and then dilate the occlusion balloon proximal to the lesion.
We conducted a multicenter study to evaluate the safety and efficacy of the first-generation OCT in comparison with IVUS, which revealed an average duration of vascular obstruction of 48.3 ± 14.7 seconds with no serious complication due to the procedure, including coronary artery dissection, embolism, severe arrhythmia (such as ventricular tachycardia or ventricular fibrillation), or myocardial infarction [2]. Additionally, OCT imaging was superior to IVUS for the visualization of the lumen border. Of note, the OCT image wire was able to cross five of six tight lesions that the IVUS catheter was unable to cross.
Although the first-generation OCT had the disadvantage of requiring a more complex procedure (i.e., balloon occlusion) than required with the IVUS, as described above, a more convenient method to remove blood was recently introduced. Kataiwa et al. [3] and Prati et al. [4] reported that blood could be removed by flushing with low-molecular-weight dextran or contrast medium through a guide catheter instead of requiring an occlusion balloon for observation.
Frequency-domain OCT
The first-generation OCT system was based on a time-domain OCT (TD-OCT) imaging method that relies on a moving reference mirror to scan each depth position in the image pixel. This mechanical scanning process limits the rate at which images can be acquired (Fig. 1A). To overcome this limitation, a new generation of OCT systems that employ frequency-domain OCT imaging methods has been developed [5,6]. These systems are known as frequency-domain OCT (FD-OCT), Fourier-domain OCT, swept-source OCT (SS-OCT), or optical frequency-domain imaging (OFDI). In FD-OCT imaging methods, interferometric data are measured as a function of optical wave-length and time, rather than as a function of time alone, based on the introduction of a fixed reference mirror and a tunable laser light source with a sweep range of 1,250-1,370 nm, instead of the broadband light source used in TD-OCT imaging systems (Fig. 1B). This imaging method enables much faster image acquisition rates and pullback speeds, resulting in a simpler, non-occlusive OCT imaging approach with flushing of viscous contrast through the guide catheter to remove blood from the artery [7].
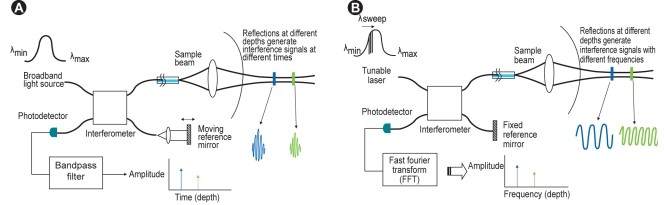
(A) Time-domain optical coherence tomography system. (B) Fourier/frequency-domain optical coherence tomography system.
Recently, a commercially available FD-OCT system has been developed (Dragonfly imaging catheter and C7-XR OCT system; LightLab Imaging, Inc.). Differences between TD- (M3) and FD-OCT (C7-XR) systems are shown in Table 2. For FD-OCT imaging using the Dragonfly imaging catheter, a ≥ 6-Fr-diameter guide catheter is recommended. Viscous iso-osmolar contrast media or low-molecular-weight dextrose can be used for non-occlusive flushing, although higher-viscosity solutions have been found to provide superior results. The OCT imaging catheter is advanced distally into the coronary artery via a standard angioplasty guide wire (0.014"). As with the non-occlusive TD-OCT technique, care should be taken to position the guide catheter coaxially and deeply into the coronary ostium. Automated intravascular OCT pullback is performed during contrast injection through the guide catheter, either automatically with a power injector (typical flush rate 3.0 mL/sec) or manually with a syringe.
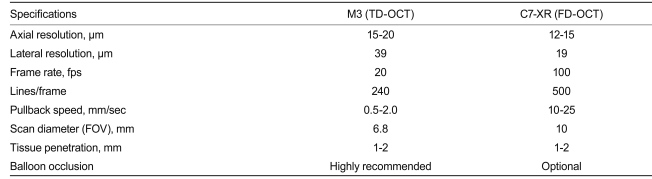
Comparison of TD-OCT and FD-OCT
A recent study showed that FD-OCT is a feasible and safe technique for the guidance of coronary interventions (see below) [3,7,8]. Larger randomized studies will confirm whether the use of FD-OCT can improve clinical outcomes.
EXAMINATION OF CORONARY ARTERY LESIONS AND OCT PLAQUE CHARACTERISTICS
Due to its high resolution (10-15 µm), OCT can differentiate the internal and external elastic laminae, as well as distinguish the intima/media/adventitia, which is impossible with the low resolution (100-150 µm) of IVUS [9]. OCT can also differentiate tissue characteristics based on polarization properties. High birefringence by polarization shift identifies fibrous tissue, collagen, and lipid composition. Low birefringence reflects calcium. By overlying low and high birefringent images on the OCT image map, tissue structures can be highlighted by tissue composition. In a comparison using autopsy specimens, Yabushita et al. [10] reported that OCT images of each type of plaque had the following features: 1) fibrous plaque: a homogenous high-signal region with low attenuation; 2) calcified plaque: a well-delineated, low-signal region with sharp borders; and 3) lipid-rich plaque: a low-signal region with diffuse borders. They reported > 90% sensitivity and specificity for detecting lipid-rich plaque, based on comparisons with pathological specimens. In another study, Kume et al. [11] also concluded that OCT had a high sensitivity for detecting lipid-rich plaque.
DIAGNOSIS OF UNSTABLE PLAQUE
In addition to its ability to detect lipid-rich plaque, as mentioned above, the high resolution of OCT makes it possible to identify a very thin (< 100 µm) fibrous cap covering a lipid core, which is difficult to detect with other modalities [12]. Autopsy studies demonstrated that fibroatheroma with a thin fibrous cap of < 65 µm (thin-cap fibroatheroma [TCFA]) is often found in culprit lesions in acute coronary syndromes (ACSs) and is considered to be a vulnerable plaque [13]. Early diagnosis of TCFAs may lead to more aggressive medical/invasive treatment of symptomatic and asymptomatic coronary artery disease to improve prognosis and clinical outcomes.
OCT-derived TCFA was defined as a lipid-rich plaque (lipid arc within a plaque in ≥ 2 quadrants) with a thin fibrous cap (thickness at the thinnest segment < 65 µm) (Fig. 2) [14]. Our OCT examination of a patient with ACS revealed ruptured plaque with a thin fibrous cap at the site of a culprit lesion that could not be detected by IVUS (Fig. 3). Kubo et al. [15] assessed culprit lesions in patients with acute myocardial infarction by OCT, IVUS, and coronary angioscopy, and reported that OCT was the most sensitive imaging modality for detecting the rupture and erosion of culprit plaque, and most frequently detected TCFAs. Additionally, OCT can distinguish between red and white thrombi using differences in the signal attenuation curve, which are frequently observed in unstable plaque [16].

Optical coherence tomography-derived thin-cap fibroatheroma was defined as a lipid-rich plaque (lipid arc within a plaque in ≥ 2 quadrants) with a thin fibrous cap (thickness at the thinnest segment < 65 µm).
Optical coherence tomography image of ruptured plaque (arrows) with a thin fibrous cap at the site of an acute coronary syndrome culprit lesion.
Moreover, OCT may be able to assess inflammatory cell infiltration, primarily active macrophages, another characteristic of unstable plaque. Based on OCT examination, MacNeill et al. [17] reported that plaque in patients with ACS had a high density of macrophages, and that this density was higher in ruptured plaque than in non-ruptured plaque.
While many authors have reported on the usefulness of OCT for tissue characterization, as indicated above, Manfrini et al. [18] performed a comparison with pathological findings and found that the detection rates by OCT differed for each type of plaque (45% for fibrous-cap atheroma, 68% for fibrocalcific plaque, and 83% for fibrous plaque). They suggested that the low detection rates for fibrous-cap atheroma and fibrocalcific plaque may be due to the inability to detect the lipid core and calcium deposits located behind a thick fibrous cap because of the low tissue penetration of OCT, and that the lipid core and calcium deposits were both seen as low-intensity areas that were difficult to distinguish. Low tissue penetration is a fundamental limitation of the current system. Moreover, distinguishing lipid from calcium is a subjective process and its precision could depend on the skill of the observer, as is the case for gray-scale IVUS. Thus, establishing objective diagnostic criteria is desirable.
APPLICATION OF OCT IN PERCUTANEOUS CORONARY INTERVENTION (PCI)
Because OCT has a high resolution, it can provide detailed information about the vessel that cannot be obtained with other modalities. Example cases are shown in Figs. 4 and 5. The case depicted in Fig. 4 demonstrated spontaneous dissection that could not be found on angiography or IVUS. Fig. 5 shows an example of a cutting balloon angioplasty. Multiple tears in the intima were observed after dilatation with a cutting balloon that also could not be detected by angiography or IVUS. Thus, this technology offers detailed visualization of vessel injury after stent implantation, such as tissue prolapse, dissections, and thrombus, and enables systematic classification and quantification in vivo [19,20].

A case with spontaneous dissection. Optical coherence tomography (C) visualized spontaneous dissection that could not be found with angiography (A) or intravascular ultrasound (B).
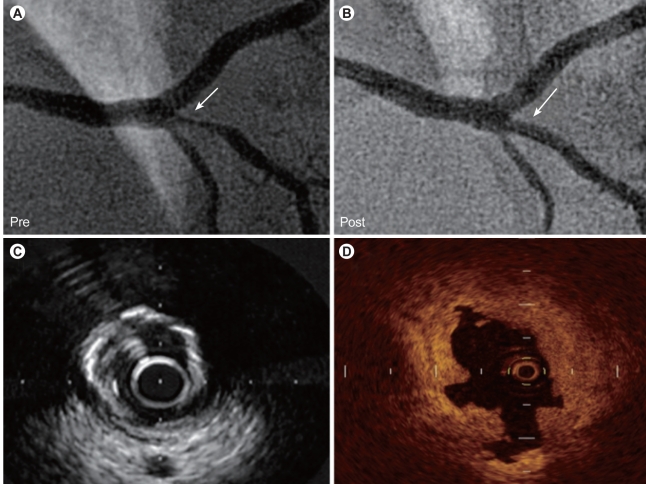
A case with cutting balloon angioplasty. Cutting balloon angioplasty was performed for stenosis in the right posterior descending artery (A, arrow). Multiple tears in the intima were observed after dilatation with a cutting balloon on the optical coherence tomographic image (D), which could not be detected by angiography (B, arrow) or intravascular ultrasound (C).
After implantation of a drug-eluting stent (DES), not only dissection, tissue prolapse, and thrombi, but also incomplete stent apposition (ISA), have attracted attention in relation to stent thrombosis and should be assessed in detail [19]. When assessing ISA, we should recall that the near-infrared light used in OCT does not penetrate metal stent struts, similar to IVUS. The stent strut is visualized as a linear structure with strong surface reflection and typical dorsal shadowing, and the posterior side of each strut near the vessel wall cannot be observed (Fig. 6) [21,22]. Thus, it is necessary to determine whether the strut has made an indentation on the intimal surface of the vessel (Fig. 6A) or to measure the distance between the surface reflection of the strut and the adjacent visible vessel surface while taking the thickness of the strut into account (Fig. 6B). To ensure the accurate assessment of ISA, we validated the accuracy of OCT measurement of the strut thickness of several commercially available stents in vitro. Differences in OCT stent strut measurements as compared with the manufacturers' nominal strut thickness data were small and reproducibility of the measurements was high, suggesting that the assessment of stent strut apposition using OCT is feasible [21].
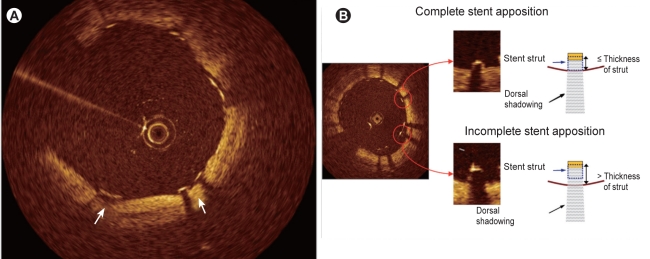
Identification of stent apposition. The stent is visualized as a linear structure with strong surface reflection and typical dorsal shadowing, and the posterior side of each strut near the vessel wall cannot be observed. Thus, it is necessary to determine whether the strut has made an indentation on the intimal surface of the vessel (A) or to measure the distance between the surface reflection of the strut and the adjacent visible vessel surface while taking the thickness of the strut into account (B).
As described above, the capability of OCT to examine the structure of the arterial wall before or after PCI is superior to those of other imaging modalities, such as angiography and IVUS, and the application of OCT during PCI seems logical and promising, yet the assessment of clinical significance to date has been limited to observations and has not necessarily included clinical outcomes. Furthermore, OCT has several inherent limitations. Given its limited penetration depth and/or scan range, the whole-vessel structure of a lesion with a large plaque burden or a large vessel cannot be visualized. Additionally, first-generation TD-OCT also requires displacement of the blood during imaging with balloon occlusion methods, making the PCI procedure more complex and precluding the use of this technique for ostial lesions, including the left main coronary artery (lesions). As the newly developed FD-OCT system does not require coronary artery occlusion and has a faster pullback speed [5,6], it may be more suitable for PCI. The clinical significance of OCT for PCI needs to be further established in larger-scale clinical trials.
OCT FOLLOW-UP EXAMINATIONS AFTER PCI
Stent strut coverage and ISA
DESs significantly suppress neointimal hyperplasia. A study of OCT and IVUS demonstrated that two-thirds of sirolimus-eluting stent (SES) struts are covered by neointima < 100 µm in thickness, which is beyond the resolution of IVUS [23]. Thus, OCT is most useful for examining patients at follow-up after DES implantation, and is capable of detecting a thin neointima due to its high resolution (Fig. 7). In recent years, late stent thrombosis in patients treated with DES has become a major concern. Delayed coverage or failure to cover an exposed stent with neointima/regenerated endothelium has been suggested as a cause of thrombosis.
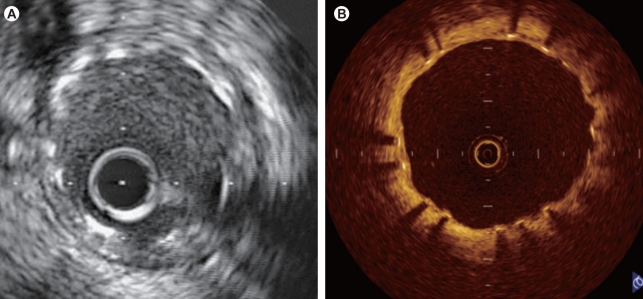
Intravascular ultrasonic (IVUS) and optical coherence tomographic (OCT) images obtained at 7 months after implantation of a drug-eluting stent (Cypher; 3.0 × 18 mm). While no obvious intimal growth is observed on the IVUS image (A), the OCT image (B) shows that the stent strut is covered by a very thin neointima (-100 µm).
Both OCT and angioscopy have been recognized as useful methods for in vivo assessment of the intimal coverage of a stent. Although angioscopy provides a wide-angle forward view, anatomical structures, such as tortuous vessels, may prohibit a complete circumferential view. While angioscopy allows direct observation of the vascular lumen and endothelial surface, the internal structure of the vessel wall cannot be assessed. Given these disadvantages of angioscopy, OCT may offer better quantitative performance for assessments. Thus, longitudinal/serial OCT studies (pre/post-intervention vs. follow-up) have been performed to evaluate the tissue coverage response of the artery to stent implantation [23-26].
Several classifications of tissue coverage of a stent strut are available [24,27]. In 2006, we proposed the OCT classification of tissue coverage of struts shown in Fig. 8 [28,29]. Although consensus on the definitions of the tissue coverage of stent struts has not yet been obtained, our classification is similar to that of Guagliumi and Sirbu [27]. The stent struts were usually assessed at 1-mm intervals, and strut, cross-section/frame, and stent/patient-base analyses were performed. Observations of struts in the same stent are not independent of one another. Using OCT, many papers demonstrated a delay in neointimal coverage following DES implantation in comparison with that of bare metal stents (BMSs), corresponding to pathological data. In comparisons among different kinds of DESs, second-generation DESs (zotarolimus-eluting [Endeavor, Medtronic CardioVascular, Santa Rosa, CA, USA] or everolimus-eluting [Xience V, Abbott Vascular Devices, Abbott Park, IL, USA; Promus, Boston Scientific, Natick, MA, USA]) demonstrated more favorable vascular healing following stent implantation, better neointimal coverage, and less ISA than did first-generation DESs (sirolimus-eluting [Cypher, Cordis Johnson & Johnson, Hialeah, FL, USA] or paclitaxel-eluting [TAXUS, Boston Scientific] stents) [25,30-32]. Furthermore, the healing processes are delayed in patients with ACS (especially ST-segment-elevation myocardial infarction) in comparison with patients with stable angina pectoris [33-35]. Stent overlapping or bifurcation/branching also affects stent strut coverage [36-39].

Classification of tissue coverage of stent struts. The left images (A, B) show uncovered struts and the right images (C, D) show covered struts. A strut with surrounding tissue beyond the strut surface is defined as covered. According to the shape of the tissue covering the struts, a covered strut is classified as convex (C) or embedded (D). The intimal thickness (NIT) was measured from the surface of the neointima covering the strut to the center line of the reflection.
Thus, it is expected that detailed findings obtained by OCT will be able to determine the characteristics of the neointima after various types of DES implantation, factors contributing to restenosis or thrombosis of DESs, and the proper use and appropriate duration of antiplatelet therapy after DES placement.
Restenotic tissue characteristics
OCT provides new insights into the characteristics of the tissue covering the stent struts. Several papers have reported OCT patterns of restenotic tissue components. A typical restenotic tissue of BMS at early follow-up (to 1 year), recognized as neointimal hyperplasia primarily composed of smooth muscle cells, is visualized as a homogeneous structure by OCT (Fig. 9A) [40]. We have, however, reported that the characteristics of restenotic tissue in the very late phase (> 5 years) is frequently demonstrated as a heterogeneous structure suggesting lipid accumulation/calcification (Fig. 9B and 9C), occasionally accompanied by disruption of the intima, microvessels within neointima, or intraluminal materials [41]. The restenotic tissue of DESs, even in an early phase, also demonstrates polymorphic patterns in structure, backscatter, and composition (Fig. 10) [42,43]. This variation in OCT images could be caused by diverse components, including mature/immature smooth muscle cells and persistent fibrin or extracellular matrix, such as proteoglycans [43]. Thus, OCT provides important information about the tissue covering the stent struts. However, few studies have sought to validate OCT findings in comparison with pathological findings, and further investigations should be conducted until the impact of these findings on clinical outcomes is known.

Optical coherence tomographic patterns of restenotic tissue following bare metal stent implantation. Homogeneous (A) and heterogeneous (B, C) intima. Lipid accumulation is suggested in the low-signal area with a diffuse lumen border within the area of neointimal hyperplasia (* in B), and calcification in the low-signal area with a sharp lumen border (* in C).

Optical coherence tomographic patterns of restenotic tissue following drug-eluting stent implantation. Patchy (A), layered (B), and speckled (C) patterns.
FUTURE DIRECTIONS
As described above, OCT is a novel, promising imaging modality with characteristics that differ from those of traditional modalities, such as IVUS and angioscopy. However, OCT does not yet have the established clinical profile or ease-of-use of IVUS. As described, the advent of next-generation OCT, FD-OCT, is expected to make the procedure easier and faster. Since OCT has received more attention in Korea, Japan, China, and Europe, increasing numbers of OCT studies are being reported. Through these studies, we hope that the clinical role of OCT in PCI will be clarified in the future. We believe that the clinical usefulness of FD-OCT is likely to be greater than that of standard/previous-generation TD-OCT.
CONCLUSIONS
OCT is an imaging modality that can be expected to become increasingly popular in the future for the diagnosis and treatment of patients with symptomatic/asymptomatic coronary artery disease.
Acknowledgments
We thank Heidi N. Bonneau, RN, MS, CCA, for her review of the manuscript.
Notes
No potential conflict of interest relevant to this article was reported.