Diagnostic Value of a Chimeric TSH Receptor (Mc4)-Based Bioassay for Graves' Disease
Article information
Abstract
Background/Aims
Graves' disease (GD) is caused by thyroid-stimulating hormone receptor (TSHR) and thyroid-stimulating immunoglobulin (TSI). We used a recently introduced, technically enhanced TSI bioassay to assess its diagnostic value and determine the cut-off in patients in high iodine intake area.
Methods
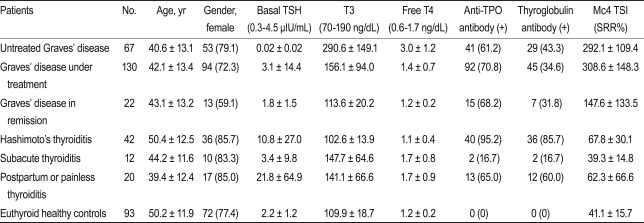
In a cross-sectional setting, we collected serum from 67 patients with untreated GD, 130 with GD under treatment, 22 with GD in remission, 42 with Hashimoto's thyroiditis, 12 with subacute thyroiditis, 20 with postpartum thyroiditis, and 93 euthyroid controls. TSI was measured using the Thyretain™ bioassay, which is based on Chinese hamster ovary cells transfected with chimeric TSHR (Mc4). TSI levels are reported as a specimen-to-reference ratio percentage (SRR%).
Results
The TSI levels in patients with GD (either treated or not) were significantly higher than those of the remaining patients (p < 0.05). The new bioassay showed a sensitivity of 97.0% and a specificity of 95.9% with a cut-off value of 123.0 SRR% for GD. A weak correlation was found between TSI and thyrotropin-binding inhibiting immunoglobulin (TBII) (rs = 0.259, p = 0.03), but no correlation was found between TSI and tri-iodothyronine or free thyroxine.
Conclusions
The Mc4-CHO bioassay showed comparable diagnostic value for GD with the conventional TBII assay. We propose a cut-off of 123.0 SRR% in areas where iodine intake is high.
INTRODUCTION
Graves' disease (GD) is caused by stimulating autoantibodies (Ab) to thyroid-stimulating hormone (also called thyrotropin) receptor (TSHR) [1]. TSHR-Abs can be measured either by bioassays or by thyrotropin-binding inhibiting immunoglobulin (TBII) assays [2]. TBIIs are quantified by receptor binding assays that measure their ability to inhibit TSHR binding by labeled TSH. These binding assays have sensitivities of 90-99% and specificities of 90-100% for diagnosing GD [3,4]. However, TBII assays cannot distinguish whether TSHR-Abs stimulate, block, or have no functional effect on the TSHR. GD bioassays detect cAMP production in different cell lines that express TSHR in response to stimulation with TSHR-simulating immunoglobulin (TSI), and can be used to determine whether pathogenic immunoglobulins are stimulative or inhibitory? TSIs in a patient's serum result in increased production of cAMP, whereas TSHR-blocking antibodies (TB Abs) inhibit cAMP production after TSH stimulation in this type of bioassay [5-7]. However, the difficulties in maintaining cell lines, the lack of laboratory automation, and longer time demands than binding assays still limit the use of these bioassays to specialized centers.
A new bioassay (Thyretain™) was recently introduced. This assay is based on Chinese hamster ovary (CHO) cells transfected with chimeric TSHR, which has amino acids 262-335 substituted with 73 amino acids from the rat luteinizing hormone (LH) receptor (Mc4) [8-10]. This substituted C-terminal area of TSHR contains epitopes for TB Abs. The Mc4 was designed to limit the effect of TB Abs that exist coincidentally with TSI in up to 25% of patients with GD and that can interfere with TSI measurements [11,12].
In this study, we evaluated the diagnostic value of this new assay and set cut-off values for diagnosing GD in Korea, where iodine intake is high.
METHODS
Patients
Samples were collected from patients that visited the outpatient clinic of the Department of Endocrinology and Metabolism at Samsung Medical Center (Seoul, Korea) between March 2010 and August 2010. We included 219 patients with GD, 42 with Hashimoto's thyroiditis, 12 with subacute thyroiditis, 20 with painless/postpartum thyroiditis, and 93 euthyroid healthy controls. The criteria for GD were based on initially documented hyperthyroidism with or without Graves' ophthalmopathy (GO) and increased uptake on technetium scintigraphy. The criteria for hyperthyroidism were clinical symptoms, increased serum concentrations of free thyroxine (T4), increased total triiodothyronine (T3), and decreased basal TSH. Patients with GD were divided into three groups according to their metabolic state and treatment history. The "untreated GD" group comprised patients who were not taking anti-thyroid medications or had been taking the medications for less than 2 weeks (n = 67); the "GD under treatment" group of patients were those that had been taking anti-thyroid medication for more than 2 weeks (n = 130); and the "GD in remission" group comprised patients free of hyperthyroidism symptoms who were not taking any medication and who had normal TSH levels (n = 22). Hashimoto's thyroiditis (n = 42) was diagnosed based on clinical hypothyroidism, sonography, and the presence of positive anti-thyroid peroxidase-autoantibodies (anti TPO Ab) and/or anti-thyroglobulin autoantibodies (anti TG Ab). We also included 12 patients with subacute thyroiditis in the study. Subacute thyroiditis was diagnosed based on clinical findings and a history of elevated erythrocyte sedimentation rates and low uptake on technetium scintigraphy. All patients with subacute thyroiditis had a history of severe neck pain. Fifteen patients with painless thyroiditis and five patients with postpartum thyroiditis (n = 20) were also included. The patients with painless thyroiditis had transient hyperthyroidism followed by hypothyroidism or recovery, whereas those with postpartum thyroiditis had the same disease course but only after pregnancy. Euthyroid healthy controls were subjects with a healthy euthyroid status and who were negative for both the anti TPO Ab and anti TG Ab (n = 93). The laboratory findings of the study subjects are summarized in Table 1. Informed consent was obtained from all patients, and the study was approved by the Institutional Review Board of Samsung Medical Center.
Clinical data for patients in the various groups
TSI bioassay
Serum TSI levels were measured with the Thyretain™ (Diagnostic Hybrids Inc., Athens, OH, USA) bioreporter assay, according to the manufacturer's instructions. Each sample was assayed in triplicate, and the mean values were used for analysis.
This bioreporter assay is specific to stimulating TSHR-Ab activation because of the chimeric receptor (Mc4) expressed on the surface of CHO cells. In Mc4, the C-terminus of TSHR (amino acids 262-335) has been substituted with amino acids 261-329 of the rat LH-choriogonadotropin (LH-CG) receptor [8]. This substituted C-terminal area of TSHR contains epitopes for TB Abs; Mc4 was designed to reduce the interfering effect of TB Abs when measuring TSIs by eliminating the epitope region of TSHR using TB Abs.
The Mc4 gene was transfected into CHO cells with a luciferase reporter gene. When TSIs bind to Mc4 receptors on Mc4-CHO cells, the resulting signal cascades stimulate increased production of intracellular cAMP. The cAMP induces activation of a promoter containing a cAMP-regulated enhancer upstream of the luciferase gene. Luciferase activity, measured as relative light units, can be determined in cell lysates with a luminometer after an enzymatic reaction containing luciferin.
Briefly, on day 1, the inner 48 wells of a Corning 96-well clear, flat-bottom, black plate were treated with a cell-attachment solution and seeded with thawed Mc4-CHO cells diluted in plating medium (all provided by the manufacturer). Plates were then incubated for 15-18 hours in a humidified 5% CO2 37℃ incubator. On day 2, we checked that all wells of the plate were confluent by assessing whether a monolayer of healthy-looking Mc4-CHO cells was present. Then the wells were washed with 37℃ warmed reaction buffer, and 100 µL reaction buffer was added to each well. After adding 100 µL sample serum (serum:reaction buffer = 1:10) to each well, the plate was incubated at 37℃ in 5% CO2 for 3 hours. After removing all solutions from the well, 75 µL cell lysis solution containing luciferase substrate was added to each well. After 10 minutes incubation at room temperature, the plate was read on a Veritas Microplate Luminometer (Turner Biosystems, Crailsheim, Germany). All assay procedures were completed within a 24-hour period.
The results of the Mc4-CHO bioassay are reported as specimen-to-reference ratio percentages (SRR%), calculated as follows: SRR% = (mean TSIspecimen / mean TSIreference) × 100. The mean TSIspecimen is the mean of triplicate luminescence measurements in the wells containing serum, and the mean TSIreference is the mean of triplicate measurements of the wells containing a reference provided by the manufacturer, which is bovine TSH at a concentration of 0.1 IU/mL.
Intra- and inter-assay precision for the Mc4-CHO bioassay was calculated from four different serum samples (high-positive, medium-positive, low-positive, and negative) by calculating the coefficient of variation (CV% = SDeach control / Meaneach control × 100).
Conventional binding assay (TBII) and thyroid function tests
TBII was measured using the human TRAK RIA kit (Brahms AG, Hennigsdorf, Germany) with a suggested cut-off value of 1.5 IU/L.
The serum concentrations of TSH, total T3, and free T4 were measured using a commercially available radioimmunoassay TSH IRMA kit (Immunotech Inc., Praha, Czech Republic; reference range 0.3 to 4.5 µIU/mL), a total T3 RIA kit (Immunotech; reference range, 76 to 190 ng/dL), and a free T4 RIA kit (Immunotech) (reference range, 0.64 to 1.72 ng/dL).
Anti TG Ab (reference range, 0 to 60 U/mL) and anti TPO Ab (reference range, 0 to 60 U/mL) were measured with anti-Tgn (Brahms AG) and anti-TPOn (Brahms AG), respectively.
Statistical analysis
Differences in continuous variables between groups were tested by independent-sample t tests. Differences between categorical variables within groups were tested with the chi-square test or Fisher's exact test, as appropriate. Correlation analyses were performed using Spearman's rank correlation coefficient.
A receiver operating characteristic (ROC) curve analysis was performed to obtain the optimal cut-off for positivity in the Mc4-TSI bioassay. The sensitivity and specificity were estimated from the ROC curves. A p value < 0.05 was considered statistically significant.
RESULTS
Diagnostic value of the Mc4-TSI bioassay
The intra-assay CVs were 3.0% for the high-positive control set (496 SRR%), 5.0% for the medium-positive control set (212 SRR%), 4.4% for the low-positive control set (144 SRR%), and 6.8% for the negative control set (41 SRR%), with mean TSI values of 496, 212, 144, and 41%, respectively. The inter-assay CVs were 10.8, 7.0, 6.6, and 19.5% with mean TSI values of 444, 199, 141, and 36 SRR%, respectively (Fig. 1). To obtain the optimal decision threshold level for diagnosing GD, an ROC analysis was performed on 67 patients with untreated GD and on 74 patients with Hashimoto's thyroiditis, subacute thyroiditis, or painless/postpartum thyroiditis. The area under the curve for the Mc4-CHO bioassay was 0.97 (95% confidence interval, 0.94 to 1.00), and the optimal cut-off was set at 123.0 SSR% with 97.0% sensitivity and 95.9% specificity for diagnosing GD (Fig. 2).
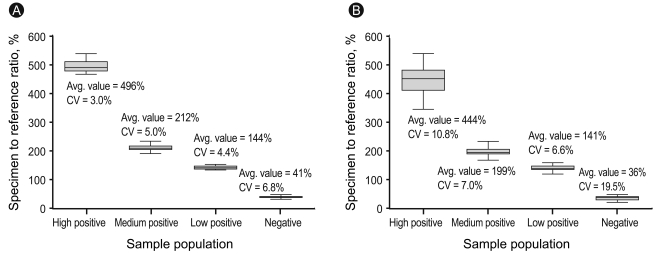
The intra-assay (A) and inter-assay (B) coefficient of variation (CV) for precision in the high-positive, medium-positive, low-positive, and negative control sets.
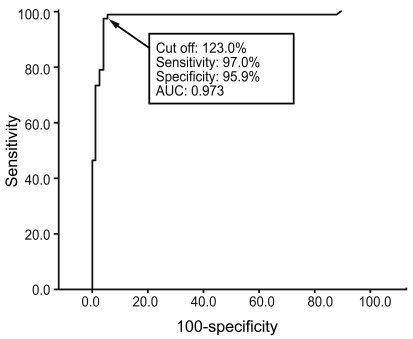
Receiver operating curve analysis of Mc4 thyroid-stimulating hormone receptor and thyroid-stimulating immunoglobulin data from 141 patients (67 with untreated Graves' disease, 42 with Hashimoto's thyroiditis, 12 with subacute thyroiditis, and 20 with painless/postpartum thyroiditis patients).
Serum TSI measurements in each study group
The distributions of serum TSI levels in each study group, as measured by the Mc4-TSI bioassay, are shown in Fig 3.

Distribution of serum Mc4 thyroid-stimulating hormone receptor (TSHR) and thyroid-stimulating immunoglobulin (TSI) values in each study group. The mean TSIs of each group of patients with Graves' disease (GD) (untreated, in treatment, and in remission) were significantly higher than those with Hashimoto's thyroiditis, subacute thyroiditis, postpartum/painless thyroiditis, and healthy euthyroid controls (p < 0.01). The line for each group indicates the mean value. The dotted line represents the cut-off value of 123.0 specimen-to-reference ratio percentage (SRR%).
Of 67 untreated patients with GD, 65 (97.0%) had positive TSI bioassay results. In contrast, of 42 patients with Hashimoto's thyroiditis, only 1 (2.4%) had a positive result, while of 20 patients with painless/postpartum thyroiditis, 2 (10%) tested positive using the new bioassay. All patients with subacute thyroiditis (n = 12) had negative results on the Mc4-TSI bioassay. None of the euthyroid healthy controls (n = 93) were positive using the new TSI bioassay.
The TSI values (mean and SD) measured by the Mc4-CHO bioassay for patients with untreated GD, GD under treatment, GD in remission, Hashimoto's thyroiditis, subacute thyroiditis, postpartum/painless thyroiditis, and euthyroid healthy controls were 292.1 (109.4), 308.6 (148.3), 147.6 (133.5), 67.8 (30.1), 39.3 (14.8), 62.3 (66.6), and 41.1 (15.7) SRR%, respectively. The TSI levels in treated and untreated patients with GD were significantly higher (p < 0.01) than those in patients with Hashimoto's thyroiditis, subacute thyroiditis, postpartum/painless thyroiditis, or the healthy euthyroid controls (Table 1).
Correlation between TSI and TBII
The Mc4-TSI values of untreated patients with GD were plotted against the TBII, total T3, and free T4 values. A weak correlation was found between TSI and TBII (rs = 0.259, p = 0.03). No correlation was found between Mc4-TSI and total T3 or free T4 (Fig. 4).
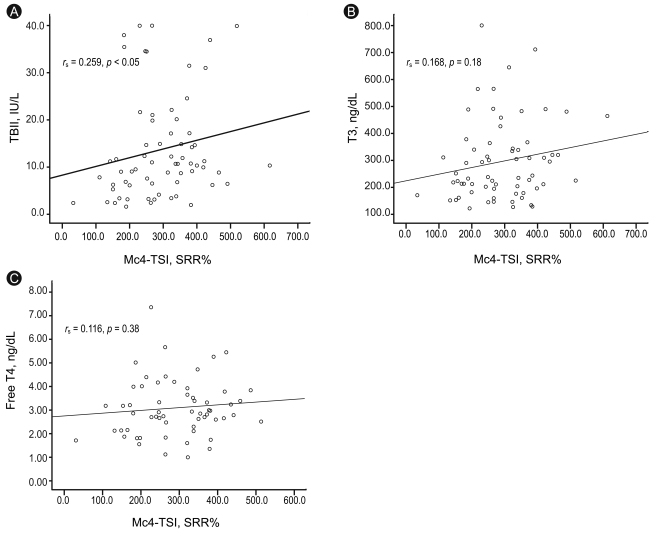
Correlation of Mc4 thyroid-stimulating hormone receptor (TSHR) and thyroid-stimulating immunoglobulin (TSI) values with thyrotropin-binding inhibiting immunoglobulin (TBII) (A), total triiodothyronine (T3) (B), and free thyroxine (T4) (C) values in 67 patients with untreated Graves' disease. TSI is represented by specimen-to-reference ratio percentage (SRR%). Correlation coefficients and p values are shown in each figure.
When we compared the positivity of the TSHR Abs in the conventional TBII test and the Mc4-TSI bioassay, there was no significant difference between these two tests within the study groups (Table 2).
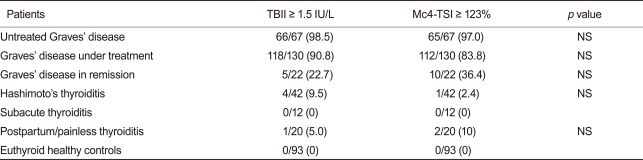
Comparison of the Mc4-TSI bioassay and TBII binding assay within each study group
DISCUSSION
Our results show that the Mc4-TSI bioassay based on Mc4-CHO cells expressing chimeric TSH receptors, which was designed to interact with stimulating but not blocking TSHR-Abs, had good diagnostic value (sensitivity, 97.0%; specificity, 95.9%) with a cut-off of 123.0 SRR%. This diagnostic value is similar to the more widely available binding assay that measures TBII but does not provide information about the TSHR-Ab function.
Our study had several limitations. First, it was a cross-sectional study that focused on the diagnostic value and the appropriate cut-off value for the new Mc4-TSI bioassay in patients from Korea, an area where iodine intake is high. Thus, we did not investigate the clinical implications of the TSI bioassay, such as the response to therapy, disease course, or prediction of relapses. Second, the diagnostic sensitivity (98.5%) of the conventional TBII assay for GD was slightly higher than that reported in another study [2]. Selection bias during enrollment of patients with GD may have influenced the results, because there was a tendency to enroll patients with a definite diagnosis of GD in this trial. Nevertheless, Mc4-TSI showed comparable diagnostic value to conventional TBII. Third, we could not compare the chimeric TSH receptor (Mc4) based bioassays, which use the human TSH receptor, due to kit unavailability. Future studies comparing the diagnostic and prognostic values between these bioassays are warranted. Finally, the clinical symptoms of GD were recorded only with regard to their presence or absence and were not graded; thus, we were not able to perform a correlation analysis between the severity of clinical symptoms and Mc4-TSI. Furthermore, the presence of eye disease was not evaluated by an ophthalmologist because the coexistence of clinical GO is uncommon in Korea [13].
Early bioassays used human thyrocytes or Fisher rat thyroid line-5 cells, and cAMP production was measured by radioisotopes; therefore, these assays were technically demanding. Later, the introduction of cell lines that stably expressed both TSHR and a luciferase reporter gene simplified the bioassays and made them more reliable, but it still took 3 days to measure TSI [5,14,15]. TB Abs that target functional epitopes on the C-terminal of the TSHR extracellular domain and that block TSHR function may exist coincidentally with TSI in 25.6% of patients with GD [11,12,16]. These TB Abs can block TSI as well as TSH and interfere with measurements of the stimulative activity of TSHR autoantibodies; therefore, a C-terminal-substituted chimeric TSHR was designed to exclude the effect of TB Abs present in the blood in one quarter of all patients with GD [8]. The Thyretain™ assay uses CHO cells transfected with a chimeric version of the TSHR (Mc4) receptor; residues 262-335 of TSHR have been substituted with 73 amino acids from the LH-CG receptor segment to improve TSI bioassay sensitivity in patients with GD. The test time for this bioassay has also been reduced from 3 days to less than 24 hours, with an improved CV. Nevertheless, this bioassay still takes much longer to perform than the widely available TBII assay, and laboratory automation remains challenging to establish, because a cell culture system is needed.
Lytton et al. [9] reported that the Mc4-TSI test has better sensitivity and specificity than TBII (97% vs. 77% and 89% vs. 43%, respectively) for detecting 155 GO cases among 200 patients with GD from Germany. They used the cut-off suggested by the company, which was 140 SSR%. However, most (156/200, 76%) of the patients with GD in their study had already been treated with drugs (123/200, 61.5%), thyroidectomy (18/200, 9%), or radioiodine (11/200, 5.5%), and the reported diagnostic value was for GO, not for GD. Furthermore, the iodine intake in Korea is very high (479 µg/day), and the average amount of urine iodine excreted is 674 µg/g Cr [17,18]. These levels are much higher than those reported in Germany, where the median intake of daily iodine is around 100 µg/day [19]. Thus, the composition of autoantibodies (stimulating and blocking TSHR), the TSI cut-off value, and the prevalence of GO are likely to differ according to country. Therefore, we assessed the diagnostic value of Mc4-TSI for GD and set the cut-off at 123.0 SRR% to distinguish between GD and various functional thyroid diseases in Korea where iodine intake is high. At this cut-off level, the Mc4-TSI diagnostic value was similar to that of the more widely used TBII binding assay (sensitivity, p > 0.05, 97% vs. 98.5%; specificity, p > 0.05, 95.9% vs. 94.3%, respectively).
Kamijo et al. [10] reported that the Mc4-TSI bioassay is superior to the conventional bioassay based on porcine thyroid cells for diagnosing 103 patients with GD from Japan (sensitivity, p < 0.05, 95.1% vs. 89.3%; specificity, p < 0.05, 96.0% vs. 86.9%, respectively). However, they did not report the TSI levels according to TBII. The diagnostic values were similar to those reported in our study, and their cut-off value of 128.0 SRR% was similar to our cut-off value of 123.0 SRR%, indicating that the new Mc4-CHO bioassay has reliable diagnostic value in areas where iodine intake is high, such as Korea and Japan.
In conclusion, the new Thyretain™ bioassay, based on an Mc4 chimeric TSHR, had comparable diagnostic value to the widely used TBII binding assay for GD. Furthermore, we propose a cut-off of 123.0 SRR% for areas where iodine intake is high. Future research on the response of GD to various treatment modalities, including anti-thyroid drugs, as well as disease prognoses, relapses, and implications of TSI for pregnancy using this new bioassay are clearly warranted.
Acknowledgments
We gratefully thank Young Gil Shin (DOW Biomedica, Inc.) and Jeffrey Houtz (Diagnostic Hybrids, Inc.) for their technical support.
Notes
No potential conflict of interest relevant to this article was reported.