Suprasternal M-mode Echocardiography of the Right Pulmonary Artery as a Model for Investigation of Pulmonary Hemodynamics in Essential Hypertension
Article information
Abstract
The right pulmonary artery(RPA) dimensions of 85 asymptomatic mild or moderate hypertension(HT) patients, divided into 6 subgroups according to the left ventricular(LV) mass index (125g/m2 BSA) left atrial (LA) dimesion index (2.2cm/m2 BSA), and 40 normal subjects were studied utilizing suprasternal M-mode echocardiography in order to examine the consistency of the elevated PA pressure in essential HT and to understand its pathogenesis.
The RPA dimension at late diastole, at the end of the right ventricular isovolumic contraction, and at systole in the subgroup of HT without LV hypertrophy and LA enlargement was significantly increased compared with those of the normal group (18.4±2.8 vs 16.2±2.3mm, 19.6±3.0 vs 17.2±1.3mm, 22.5±2.5 vs 20.8±1.9mm, p<0.05, respectively) and varied in close correlation with systolic and diastolic BP and the dimension of the aorta. The dimensions in the other 5 subgroups were the same and were not further affected by the LV mass and LA dimension.
The above results suggest that elevated systemic BP per se is associated with the dilation of the RPA supposedly caused by increased PA resistance, besides the backward effect of the increased LV and/or LA pressure which may affect the increase of PA pressure.
INTRODUCTION
It has been reported in the past three decades that in a considerable number of cases of systemic hypertension without clinical signs of heart failure, pulmonary artery pressure is higher than normal.1,2) The pathogenesis of elevated pulmonary artery pressure and its clinical consequences in systemic hypertension are not yet known.
Because of the difficulty of invasively measuring the pressure of the pulmonary artery in asymptomatic hypertension, the elevated pulmonary artery pressure has not been previously appreciated. We observed a few years ago that in the study of baroreflex sensitivity in essential hypertension, pulmonary arterial pressure was significantly elevated above that of normal subjects [mean; 20.6 mmHg (N = 5) vs 11.4 mmHg (N = 7)].3,4) However, this observation could not be confirmed because of the absence of an easy method for studying the hemodynamics of the pulmonary artery. Therefore, a new approach to observing the hemodynamics of the pulmonary artery was clearly necessary. The dimensions of the right pulmonary artery(RPA) could be easily recorded by echocardiography at the suprasternal fossa with good reproducibility and without risk. Furthermore, the dimensions of the pulmonary artery are well correlated with its intraluminal pressure.5)
We attempted to measure RPA pressure noninvasively by utilizing suprasternal echocardiography. Our study was designed to investigate the possibility that the pressure of the RPA could be extrapolated noninvasively from the change in its superior-inferior dimension measured with suprasternal M-mode echocardiography. We propose suprasternal M-mode echocardiography as a model for investigation of RPA hemodynamics and verify the hypothesis that pulmonary arterial pressure and resistance may increase in correlation with systemic blood pressure and resistance, and the dimension of the pulmonary artery may well be correlated with its intraluminal pressure, therefore, this dimension may be increased in essential hypertension.
METHOD
1. Subjects
Preliminary measurements of blood pressure were performed in subjects by sphygmomanometry. These measurements were obtained in normotensives and hypertensives, none of whom took any medication before the study. The subjects were 40 normotensives (diastolic blood pressure: below 90 mmHg) 24 to 59 years old (20 males and 20 females) and 85 patients with mild (diastolic blood pressure: 90 to 104 mmHg) or moderate essential hypertension (105 to 114 mmHg) 22 to 59 years old (40 males and 45 females).
Diastolic blood pressure was determined as an average of two readings obtained more than ten minutes apart after the patient had been sitting. The disappearance of Korotkoff’s sound (phase 5) was used to define diastolic pressure.
To be acceptable for study, we had to demonstrate the absence of congestive heart failure, pulmonary disease, chest wall deformity or any systemic illness able to affect pulmonary hemodynamics in subjects.
2. Suprasternal and Precordial M-mode Echocardiography
The ultrasonographic recording of the RPA was made with the subject in the supine position with hyperextension of the neck. The Advanced Technology Laboratories (ATL) MK-500, utilizing a transducer with a frequency rate of 2.5 MHz, was employed. The transducer was placed in the suprasternal fossa with an ultrasonic beam directed posteriorly and inferiorly to record RPA under the guidance of a 2-dimensional echocardiogram with a recording speed of 50 to 100 mm/sec.6,7)
Measurement of three variables of RPA dimension was employed (RPA a-dip, RPAic, RPAs). RPA a-dip was the dimension of the right pulmonary artery immediately before left atrial contraction; RPAic, at the end of isovolumic contraction; and RPAs, the largest dimension of the right pulmonary artey in systole (Fig. 1).8) The systolic widening rate(SWR) as an index of vasomotility was calculated as follows:

A suprasternal M-mode echocardiogram of RPA and illustration of the measurements.
1: RPA a-dip; dimension of right pulmonary artery (RPA) immediately before left atrial contraction.
2: RPA ic ; dimension of right pulmonary artery at the end of isovolumic contraction.
3: RPA s ; largest dimension of right pulmonary artery in systole.
To estimate the chronological difference in the change of the systemic and pulmonary circulations, the RPAic dimension vs. aortic dimension ratio (RPAic/AOD ratio) was calculated.
Left atrium (LA), left ventricle (LV) and aorta recordings were made by the standard method in the left parasternal area as recommended by the American Society of Echocardiography (ASE).9–12) The criteria for left atrial enlargement was a left atrial dimension index (LAI) greater than 2.2 cm/m2 B.S.A. and for left ventricular hypertrophy, above 125 gm/m2 B.S.A. in left ventricular mass index (LVMI).
For the purpose of examining the effect of left ventricular hypertrophy(LVH) or left atrial enlargement on RPA dimension, we divided the 85 hypertensive subjects into 6 groups according to LVMI (125 gm/m2) and LAI (2.2 cm/m2). Group A was composed of subjects without left atrial enlargement, of which subgroup A1 had no LVH and subgroup A2 had LVH. Group B were subjects with left atrial enlargement, comprising subgroups B1 (no LVH) and B2 (with LVH). Group C were those subjects without LVH (A1 and B1) and group D were those subjects with LVH (A2 and B2) (Table 1). We compared RPA dimensions of each group of hypertensives with those of normotensives and observed the correlation of RPA and aorta dimension with systolic and diastolic blood pressures.
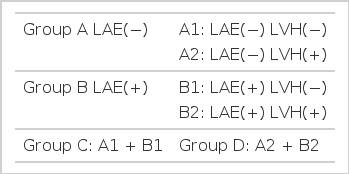
Grouping of the Hypertensive Subjects
RESULTS
Characteristics of subjects and echocardiographic data for each group appear in Table 2. The age, sex and ejection fraction of the left ventricle did not differ significantly between normotensives and each group of hypertensive subjects. Mean systolic and diastolic blood pressures of hypertensive groups were higher than those of the normotensive group (p<0.05 for each) but there was no difference in each group of hypertensive subjects.
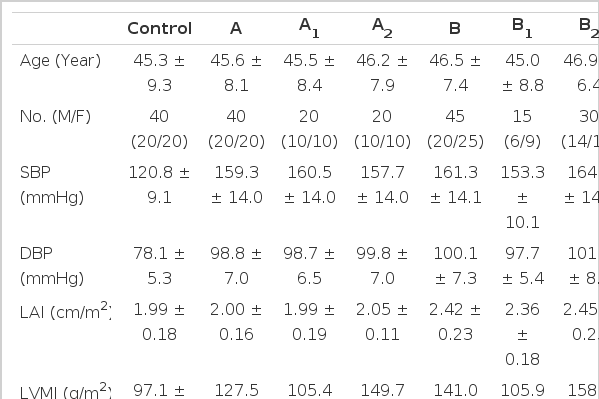
Characteristics of Subjects Studied and Dimensions of RPA and Aorta in Control & Each Group of the Hypertensive Subjects according to the LAI & LVMI.
In the normotensive subjects, the dimension of RPAa-dip was 16.2 ± 1.3mm, RPAic 17.2 ± 1.3mm, and RPAs 20.8 ± 1.9mm. In group A, the dimension of RPAa-dip was 18.6 ± 2.3mm, RPAic 19.9 ± 2.3mm, and RPAs 22.7 ± 2.2mm; in A1, RPAa-dip was 18.4 ± 2.8mm, RPAic 19.6 ± 3.0mm, and RPAs 22.5 ± 2.6mm; and in A2, RPAa-dip was 19.0 ± 1.7mm, RPAic 20.4 ± 1.6mm, and RPAs 23.5 ± 1.6mm. In group B, the dimension of RPAa-dip was 19.1 ± 2.5mm, RPAic 20.6 ± 2.6mm, and RPAs 23.2 ± 2.9mm; in B1, RPAa-dip was 18.3 ± 1.9mm, RPAic 19.8 ± 1.9mm, and RPAs 22.4 ± 2.3mm; and in B2, RPAa-dip was 19.5 ± 2.7mm, RPAic 20.9 ± 2.8mm, and RPAs 23.5 ± 3.0mm. In group C, the dimension of RPAa-dip was 18.4 ± 2.5mm, RPAic 19.8 ± 2.7mm, and RPAs 22.5 ± 2.7mm. In group D, the dimension of RPAa-dip was 19.3 ± 2.3mm, RPAic 20.7 ± 2.4mm, and RPAs 23.6 ± 2.6mm. Every dimension of RPA was significantly increased in every group of the hypertensives but there was no difference between each of the hypertensive groups (A, A1, A2, B, B1, B2, C and D) (Fig. 2).

RPAic dimension in control and each of the hypertensive groups.
*: Difference vs. control p<0.05.
The systolic widening rate of RPA in normotensives was 20.7 ± 6.1 %, and in group A 14.6 ± 5.2%, A1 13.9 ± 4.7%, A2 15.1 ± 5.6%, B 13.0 ± 4.3%, B1 13.1 ± 4.6%, B2 12.7 ± 4.2%, C 13.8 ± 5.1% and group D 13.8 ± 4.9%. The systolic widening rate in all hypertensive groups was significantly less than normotensives (p<0.05, respectively) but no difference between each of the hypertensive groups was found (Fig. 3).

Systolic widening rate in control and each group of the hypertensive subjects.
* : Difference vs. control p<0.05.
The RPAic/AOD ratio in normotensives was 0.6 ± 0.07 and there was no difference between normotensives and each of the hypertensive groups (Fig. 4).

RPAic/AOD ratio in control and in each group of the hypertensive subjects.
In the correlation of RPA dimensions and SWR with blood pressures and aortic dimension, RPAa-dip was positively correlated with systolic BP (r = 0.46), diastolic BP (r = 0.48) and aortic dimension (r = 0.41, p<0.05, respectively); RPAic with systolic BP (r = 0.46, Fig. 5), diastolic BP (r = 0.49, Fig. 6) and aortic dimension (r = 0.44, Fig. 7. p<0.05, respectively); and RPAs with systolic BP (r = 0.35), diastolic BP (r = 0.35) and aortic dimension (r = 0.44, p<0.05, respectively). SWR was negatively correlated with systolic BP (r = −0.42) and diastolic BP (r = −0.49, p<0.05, respectively), the aortic dimension was positively correlated with systolic BP (r = 0.30) and diastolic BP (r = 0.33, p<0.05, respectively, Table 3). The above results suggest that the increase of each RPA dimension in the hypertensives was in proportion to systolic and diastolic BP and aortic dimension.

Correlation of RPAic dimension to systolic blood pressure(SBP) (Numerals in the graph denote the numbers of cases identical in their ordinate and abscissa values).

Correlation of RPAic dimension to diastolic blood pressure (DBP).

Correlation of RPAic dimension to aortic root dimension (AOD).

Correlation Coefficients of Dimensions, Systolic Widening Rate of RPA and Aortic Root Dimension vs Blood Pressures and Aortic Root Dimension
DISCUSSION
Olivari et al.13) reported that pulmonary arterial pressure and resistance are increased in essential hypertension and its increase may not be caused by left ventricular end-diastolic pressure. Atkins et al.14) reported that pulmonary vascular resistance was positively correlated with systemic vascular resistance, and Guazzi et al.15) observed that the pulmonary vasculature of the lesser circulation in essential hypertension responded to pharmacologic agents in proportion to the increase of blood pressure and vascular resistance of greater circulation; therefore, a common pathogenesis may exist in the two circulations.
The pathogenesis by which pulmonary arterial pressure is increased in essential hypertension would be related to the increase of pulmonary blood pressure regardless of pulmonary blood volume, LV filling pressure and LV function.16–18) The pulmonary vascular resistance might be increased by the common factors resulting in the increase of systemic vascular resistance.19) The dimension of the pulmonary artery could be increased if circulating blood volume were displaced to the central circulation by an increase in venular tone20) and intravascular blood volume of the pulmonary artery was increased by left to right shunt21) or pulmonary congestion secondary to left ventricular failure.8)
This study was designed to exclude factors that could affect pulmonary arterial dimension except for intravascular pressure. Therefore, the increase of pulmonary arterial dimension could be said to reflect an increase of pulmonary arterial pressure. The increase of pulmonary arterial pressure(PAP) could be caused by the backward effect of LV or LA pressure on the pulmonary circulation, or primarily by increased pulmonary vascular resistance or pulmonary blood flow. Although the pressure of the LV or LA has not been recorded in this study, we investigated the backward effects of the systemic circulation on the pulmonary circulation with the assumption that the LV hypertrophied secondary to an increase of aortic pressure and peripheral vascular resistance,22–24) LV hypertrophy in turn results in a decrease of elasticity of LV, an increase of LA pressure and the LA enlargement of essential hypertension.25) But we could not observe the difference of RPA dimension by comparing LAH or LVH groups with non-hypertrophied groups. The pulmonary arterial dimension can be changed by an increase in pulmonary blood flow; but in our study we exclude such conditions. Therefore, it was suggested that the increase of PA dimension could be caused by an elevation of PA pressure and pulmonary vascular resistance as suggested in previous reports. The pulmonary vascular resistance responsive to vasodilator or vasopressor drugs was said to be related to systemic pressure and resistance.19,26–28) This could be confirmed by studies in which PA, LV and LA pressures were recorded by a sensitive transducer and the response to diurnal, physiological and pharmacological effects were observed.
The RPAic/AOD ratio of the hypertensive groups coincides with that of normotensives. The RPA dimension was significantly correlated with systolic BP, diastolic BP and aortic dimension. These findings suggest that the pulmonary arterial dimension increased in proportion to PA pressure, such as the dimension of the aorta increases in proportion to the systolic BP and diastolic BP. Kasper et al.5) observed that pulmonary arterial dimension was increased in cases of elevated pulmonary arterial pressure and this finding coincided with our study.
The systolic widening rate of RPA was decreased in the hypertensive groups and this was thought to be caused by the decrease of pulmonary arterial compliance and an increase of pulmonary vascular resistance.
The aortic dimension increases as the blood pressure of the hypertensive patient is gradually elevated as time passes. The fact that the RPAic/AOD ratio of the hypertensive groups nearly coincided with that of normotensives in our study suggests that the times required for increase in the dimensions of the aorta and pulmonary artery were much the same. These findings suggest that PA pressure is elevated coincidentaly with the elevation of aortic pressure.