Effects of Cyclosporin A on Insulin Binding and Action in Isolated Fat Cells of Rat
Article information
Abstract
To study the effect of cyclosporin A (CsA) on glucose metabolism in peripheral insulin target cells, we studied the intraperitoneal glucose tolerance test (i.p. GTT), insulin binding, glucose transport and lipogenesis in isolated adipocytes of CsA-treated male Wistar rats. The rats were treated for 7 days with an intramuscular injection of vehicle (control group), or 5 (group I) or 50 mg/kg body weight (group II) of CsA dissolved in ethanol. The results of i.p. GTT in group II showed markedly impaired glucose tolerance with significantly decreased basal and glucose-stimulated serum insulin levels. In isolated adipocytes of CsA-treated rats, the insulin bindings were decreased by 26% in group I and 32% in group II. The maximum insulin-stimulated glucose transports were decreased by 34% in group I and 41% in group II. The maximum insulin-stimulated lipogenesis was decreased by 33% in group I and 37% in group II. There was a right shift of the dose response curves for insulin of glucose transport and lipogenesis of both CsA-treated groups.
In conclusion, these results suggest that CsA produces significant functional changes of pancreatic B cells and also induces insulin resistance in adipocytes due to combined receptor and postreceptor defects in insulin action.
INTRODUCTION
Cyclosporin A (CsA) is an immunomodulatory substance that acts specifically at an early stage in activation of T lymphocytes and inhibits interleukin II synthesis by activated helper T cells.1)
Despite the renal and hepatic toxicities of CsA,2,3) it has been widely used in organ transplantation and various autoimmune diseases as a powerful immunosuppressive agent.4) It has also been used in type I diabetics with some promising results.3)
But recently, a few studies, including our previous study, suggested that it induces abnormalities of glucose metabolism and morphological changes of the pancreatic B cells in experimental animals.5,9) But the effect of CsA on the peripheral insulin target cells has not been reported.
To extend the study on the effect of CsA on glucose metabolism at the peripheral insulin target cell level, we studied insulin binding, glucose transport and lipogenesis in isolated adipocytes of CsA-treated rats.
MATERIALS AND METHODS
1. Animals
Male Wistar rats weighing 180 to 220 gm were kept on a standard pellet diet and tap water ad libitum before experiments. The rats were treated for 7 days with an intramuscular injection of vehicle (control group), or 5(group I) or 50 mg/kg body weight (group II) of CsA dissolved in ethanol. To study the intraperitoneal glucose tolerance test (i.p. GTT), the control and group II, consisting of 10 rats each were used. On day 8, the serum glucose concentration at basal 30, 60, 90, and 120 minutes with the serum insulin concentration at basal conditions and 60 minutes after i.p. GTT (20% glucose; 2g/kg body weight) were measured. To study the insulin bindings, glucose transport and lipogenesis, the control, group I and group II, each consisting of 20 rats, were used.
2. Materials
Porcine monocomponent insulin was obtained from Nordisk Co. (Denmark). [125I]-insulin (SA 250 uCi/ug) was purchased from New England Nuclear Co. (Boston, Mass). D-glucose, bovine serum albumin (fraction V) and collagenase (type II) were purchased from Sigma Chemical Co. (St. Louis, Mo) and 2-deoxy-D-[1-3H] glucose (SA 22 Ci/mmol) and D-[3-3H] glucose (SA 5.3Ci/mmol) were purchased from Radiochemical Centre (Amersham, England). CsA was purchased from Sandoz Co (Basel, Switzerland).
3. Serum Insulin and Glucose Measurements
Serum glucose level was determined by a glucose oxidase method and serum insulin level was determined by a radioimmunoassay method (Insulin RIA kit, Cambridge, Medical Diagnostics Inc., U.S.A.).
4. Adipocyte isolation
Isolated adipocytes were prepared after treatment of CsA or vehicle for 7 days as described by Rodbell10) and modified by Gliemann.11) Briefly, epididymal fat pads from each rat were incubated in vials containing collagenase, bovine serum albumin (20 g/l) and D-glucose (0.05 mmol/1) in Krebs-Ringer bicarbonate buffer. The air in the vials was displaced with oxygen-carbon dioxide (95-5%) and the vials were incubated in a metabolic shaker at 37°C for 90 min. The suspension was filtered through a nylon mesh. The adipocytes were left to float to the surface and the infranatant was aspirated and replaced with buffer. The number of adipocytes was determined by counting the cells in a hemocytometer. The viability of adipocytes was assessed by the trypan blue dye exclusion test.
5. Binding Studies
Isolated adipocytes (2×10⁵ cells/ml), suspended in a Tris buffer containing bovine serum albumin (30 g/l), were incubated with 125I-insulin (0.2 ng/ml) and various concentrations of unlabeled insulin in plastic vials in a shaking water bath for 90 minutes at 37°C. The incubations were terminated by removing aliquots (200 ul) from the cell suspension and rapidly centrifuging the cells in plastic microcentrifuge tubes to which 100 ul of silicone oil had been added. The cells were then removed and the radioactivity was determined. In these experiments, nonspecific binding was defined as the amount of 125I-insulin remaining in the cell layer in the presence of a large excess (2×10³ ng/ml) of unlabeled insulin.
6. Glucose Transport Studies
Glucose transport was measured by the method of Olefsky12). To measure the stimulatory effect of insulin no the uptake of 2-deoxyglucose, the cells were preincubated with insulin for 1 hr at 37°C. Isolated adipocytes (0.5×10⁵ cells/ml) were incubated with 2-deoxy-D-[1-3H] glucose (SA 22 Ci/mmol) at a concentration of 0.2uCi/ml in Krebs-Ringer bicarbonate buffer (pH 7.4) containing bovine serum albumin (30 g/l). The assay was terminated at the end of a 3-min incubation at 37°C by transferring 200 ul aliquots from the cell suspension to plastic microcentrifuge tubes containing 100 ul of silicone oil. The incubation was considered to be terminated at the instant centrifugation began. The radioactivities of the adipocyte layers were counted by Packard liquid scintillation spectrometer (TRI-CARB 300C) after mixing with 100 ml of toluene scintillant. Results were expressed as the quantity (DPM: the activity of disintegrating atoms per minute) of 2-deoxyglucose transported to adipocytes (105 cells) under the insulin stimulation for 3 minutes and plotted on the y-axis.
7. Lipogenesis
Lipogenesis from glucose was determined by the method of Moody et al..13) After the adipocytes (0.5×10⁵ cells/ml) had been incubated in a shaking water bath at 37°C for 90 minutes in 1 ml of medium containing D-glucose (0.05 mmol/l), 3-[3H]-glucose 0.1 uCi and various insulin concentrations (0–38 ng/ml), [3H]-lipid was extracted into toluene scintillant and counted by Packard liquid scintillation spectrometer. Results were expressed as amounts of glucose (nmol) converted to toluene-extractable lipid in 90 minutes by 105 cells and plotted on the y-axis.
8. Analytical procedures
The values of insulin binding, glucose transport and lipogenesis were expressed as means ± SD of 3 separate experiments performed on different days. Comparisons were made using Student's t-test of statistical significance and differences were accepted as significant at the p<0.05 level. For convenience of expression, the results of glucose transport and lipogenesis of experimental groups were calculated as percents of the control values.
RESULTS
1. Experimental Animals
Table 1 summarizes the characteristics of the control and CsA-treated rats. As can be seen, the CsA-treated rats lost rather than gained weight 7 days after CsA injection. Serum glucose concentrations the CsA-treated rats at 0, 30, 60, 90 and 120 minutes on the 8th day after i.p. GTT were increased significantly compared with those of the control rats (Fig. 1). But basal and 60 minute serum insulin concentrations were decreased significantly compared with those of the control rats (Fig. 2).
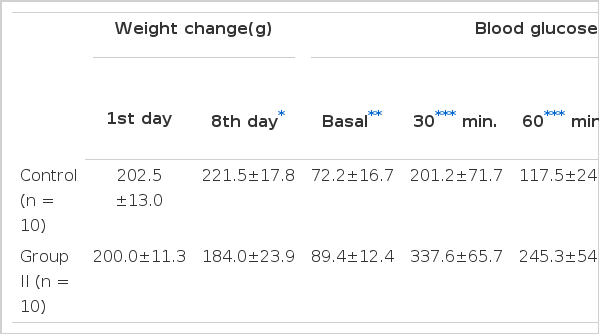
The Results of Weight Change and Intraperitoneal Glucose Tolerance Test in Rats After Intramuscular Injections of Vehicle (Control) or Cyclos-Porin A 50 mg/kg (group II) for 7 Days
Intraperitoneal glucose tolerance test. Values shown are means ± S.D. * p<0.02, ** p<0.005
Serum insulin concentrations at basal and 60 min, after intraperitoneal glucose tolerance test. Values shown are means ± S.D. * p<0.02. ** p<0.005
2. Insulin Binding Studies
Maximum insulin binding to adipocytes in both groups I and II was decreased significantly compared with that of the control rats. Maximum insulin bindings of control, group I and group II rats were 2.26%, 1.74% and 1.52% of the total insulin, respectively (Fig. 3).
Competition-inhibition effect of cyclosporin-A on insulin binding to 2×10⁵ adipocytes/ml. Values shown are means ± S.D.. Each value on curve for control was significantly greater than that for CsA-treated rats at p<0.05 by paired t test.
3. Glucose Transport Studies
To evaluate an early step of insulin action at the postreceptor level, glucose transport studies were performed. Basal and insulin-stimulated glucose transport activities in adipocytes from CsA-treated groups were decreased markedly compared with those of the controls. The maximum glucose transport was decreased by 34% in group I and 41% in group II compared with that of the control rats (Fig. 4).

Mean dose-response curves for insulin-mediated glucose transport in adipocytes. Results are plotted as percent of maximal response (means ± S.D.). Each value on curve for control was significantly greater than CsA-treated rats at p<0.005 by paired t test.
4. Lipogenesis
To analyze one of the major pathways of glucose metabolism at the postreceptor level, the rate of glucose conversion to triglycerides was measured in the absence and presence of insulin with adipocytes from control and CsA-treated groups.
Basal and insulin-stimulated lipogenesis in both groups of CsA-treated rats were decreased compared with those of the control rats. The maximum lipogenesis was decreased by 33% in group I and 37% in group II compared with that o the control rats (Fig. 5).

Mean dose-response curves for insulin-mediated lipogenesis in adipocytes. Results are plotted as percent of maximal response (means ± S.D.).
Each value on curve for control was significantly greater than that for CsA-treated rats at p<0.05 by paired t test.
DISCUSSION
Until now, few reports have existed about the effects of CsA on pancreatic B cells.6,9) Two years ago, we also studied the morphological and functional effects of CsA on the pancreatic B cells of Wistar rats.5) These results suggested that CsA induces significant morphological changes and impaired glucose tolerance by reducing insulin secretion. In our previous study on the effect of CsA to the pancreatic islets of CsA-treated Wistar rats (CsA 50 mg/kg i.m. for 7 days), there was prominent sinusoidal widening of islets and significant degranulations of pancreatic B cells in microscopic examination. In electron microscopic examination, pancreatic B cells showed many deformed cytosolic granules of floccular appearance due to a low, dense, coarse, granular matrix. Fusion of granules and the leakage of the granular content to the cytoplasmic matrix by dissolution or rupture of the limiting membrane were also observed.5)
As a functional study, we also performed i.p. GTT in CsA-treated groups. The results of i.p. GTT performed in the CsA-treated group showed significantly impaired glucose tolerance with the decreased basal and glucose-stimulated serum insulin levels. Such effects of CsA on glucose tolerance and insulin had been suggested by several clinical and experimental studies.7,14,17)
In terms of possible CsA toxicity at the cellular level, there is various indirect evidence. CsA is known to act as an inhibitor of protein synthesis by influencing mRNA synthesis.18) Ried et al.19) demonstrated that fat tissue in CsA-treated patients contains the highest deposits of CsA among the various tissues due to its lipophilic nature. Yale et al.7) previously suggested that altered insulin sensitivity or insulin resistance might be present in rats during CsA administration because of the improvement of glucose tolerance 2 weeks after withdrawal of CsA, even though plasma insulin responses remained decreased.
The afore mentioned evidence suggests the possibility that CsA may influence insulin action at the peripheral insulin target cell level.
In this study, in order to evaluate the effects of CsA on insulin action at the peripheral insulin target cell level, we measured insuling binding, glucose transport and lipogenesis in adipocytes from CsA-treated rats. In spite of the decreased serum insulin level, the results of insulin binding in adipocytes of both CsA-treated groups were decreased in a dose-dependent manner. And basal and insulin-stimulated glucose transport and lipogenesis were decreased at all insulin concentrations with a right shift of the dose response curve in a dose-dependent manner compared to that of controls. In general, insulin binding in an insulin deficient state, such as that in streptozotocin-induced experimental animals is increased due to up regulation of insulin receptors with the decreased activities of glucose transport and lipogenesis.20,21) Accordingly, the decreased insulin binding activities in adipocytes of CsA-treated rats may be a characteristic finding. These findings suggest that the decreased insulin binding and insulin action in adipocytes of CsA-treated rats is probably the direct effect of CsA on the adipocytes.
In conclusion, these results suggest that CsA produces significant morphological and functional changes of the pancreatic B cells and also induces insulin resistance in fat cells due to combined receptor and postreceptor defects in insulin action.
In the future, further study of the pathogenic mechanism of CsA-induced insulin resistance in peripheral insulin target cells must be undertaken.
Notes
A preliminary report of this work was presented at the meetings of the 13th International Diabetes Federation (1988) and 5th Korea-Japan Symposium on Diabetes Mellitus (1989).
This work was supported in part by the clinical research funds of Catholic Medical Center