Insulin Binding and its Action in Adipocytes of Hyperthyroid and Hypothyroid Rats*
Article information
Abstract
The studies of the effects of thyroid hormone on insulin secretion and glucose metabolism have been made, but the results have been controversial.
In order to evaluate the effects of thyroid hormone at the cellular level, insulin binding and insulin-induced lipogenesis in isolated rat epididymal fat cells were studied in control, hyperthyroid and hypothyroid rats. Hyperthyroidism was induced by daily intraperitoneal injection of sodium L-thyroxine and hypothyroidism by a single injection of 131I. The adipocytes were isolated by treatment of collagenase as originally described by Gliemann (1967).
The results were as follows:
1) The fasting serum insulin levels of hyperthyroid (21.6 ± 3.7 uU/ml) and hypothyroid groups (20.5 ± 7.0 uU/ml) were not different from the value of control (23.1 ± 11 uU/ml). The fasting blood glucose level of hypothyroid group (164.9 ± 12.0 mg/dl) was higher than the values of the controls (148.2 ± 13.2 mg/dl) or the hyperthyroid group (147.0 ± 12.5 mg/dl), (p<.005).
2) The specific 125I-insulin binding of the hyperthyroid group was not different from the value of the controls, but the value of the hypothyroid group was higher than the value of the controls (p<.005).
3) The insulin receptor concentration of the hypothyroid group (1.09 ± 0.02 ng/0.5×105 cells) was higher than the value of the controls (0.72 ± 0.01 ng/0.5×105 cells) or the hyperthyroid group (0.79 ± 0.02 ng/0.5×105 cells), (p<.05).
4) The average affinities of the receptors in all groups showed an inverse correlation with the insulin concentration. The average affinity of the hypothyroid group was higher than the value of the control or the hyperthyroid group.
5) Insulin-induced lipogenesis was reduced proportionately in all insulin concentrations in both the hyperthyroid and hypothyroid groups compared with the dose-response curve of the control group. The maximal amount of lipogenesis of the hyperthyroid and hypothyroid groups were 63.4% (p<.05) and 32.3% (p<.005) of the controls, respectively.
These studies suggest that thyroid hormone may regulate the concentration of insulin receptors, and altered thyroid states reduce insulin-induced lipogenesis in the adipocyte at postreceptor levels.
INTRODUCTION
Glucose intolerance is frequently observed in hyperthyroidism and, the development of hyperthyroidism in diabetic patients is often accompanied by a further deterioration of glucose control. These findings suggested that thyroid hormones may affect the secretion or action of insulin. But it is not known whether the underlying mechanisms are due to a defect in insulin secretion or insulin action.
Studies of the effects of thyroid hormones on insulin secretion have yielded conflicting results. Thus, it has been reported that insulin secretion is decreased1) or increased2) in hyperthyroidism and decreased3) in hypothyroidism.
Accordingly, mechanisms of the influence of thyroid hormones on insulin secretion still remain controversial. However, Andersen et al4) observed the increased level of plasma glucose concomittant with an increased insulin secretion in hyperthyroidism, and suggested that thyroid hormones developed a decreased insulin sensitivity at the target tissue level.
Arner et al.34) also suggested that thyroid hormones regulate the effect of insulin action, which occurs at receptor and post-receptor levels in the target tissue. In the present study, the authors examined the mechanism of the effect of thyroid hormones on insulin action at target tissue levels, using isolated fat cells from experimentally induced hyperthyroid and hypothyroid rats.
The binding of insulin to isolated fat cells and the effect of insulin on fat cell lipogenesis were determined.
MATERIALS AND METHODS
(125I)-monoiodinated insulin (S.A. 250 uCi/ug) was purchased from New England Nuclear Co. (Boston, Mass). Porcine monocomponent insulin was obtained from Novo Ind. (Denmark). D-glucose, bovine serum albumin (fraction V) and collagenase (type II) were purchased from Sigma Chemical Co. (St. Louis, Mo.). D-(3-3H) glucose (S. A. 5.3 Ci/mmol) was purchased from Radiochemical Centre (Amersham, England).
1. Animals
Male Wister rats Weighting 100–150 gm were used.
In order to induce hyperthyroid rats, sodium L-thyroxine (50 ug per 100 gm body Weight) disolved in 0.1 N NaOH and 2% human albumin was injected into the peritoneum for 7 days as described by Laker and Mayes10) and to induce hypothyroid rats, 131I (0.4 mCi per 100 gm body Weight) was injected into the peritoneum 3 weeks prior to use as described by Ahren and Lundquist11)
2. Adipocytes Isolation
Isolated fat cells were prepared as described by Rodbell12) and modified by Gliemann13). Briefly, the epididymal fat pads from each rat were incubated in vials containing collagenase, bovine serum albumin (30 g/l) and D-glucose (0.05 mmol/l) in a Krebs-Ringer bicarbonate buffer solution. The air in the vials was displaced with oxygen-carbon dioxide (95.5%) and the vials incubated in a metabolic shaker at 37°C for 90 minutes. The suspension was filtered through nylon mesh. The fat cells were left to float to the surface and the infranatant was aspirated and replaced with buffer. The number of fat cells was determined by counting the cells in a hemocytometer.
3. Insulin Binding
Isolated fat cells suspended in a Tris buffer containing bovine serum albumin (30g/1) were incubated with 125I-insulin(0.2 ng/ml) and various concentrations of unlabeled insulin in plastic vials in a shaking water bath for 90 minutes at 37°C. The incubations were terminated by removing aliquots (200 ul) from the cell suspension and rapidly centrifuging the cells in plastic microtubes to which 100 ul of silicone oil had been added. Silicone oil has a specific gravity between that of buffer and cells; therefore after centrifugation, three layers result: cells on top, oil in the middle, and buffer on the bottom. The cells were then removed and the radioactivity was determined. In these experiments, nonspecific binding was defined as the amount of 125I-insulin remaining in the cell layer in the presence of a large excess (2 × 10³ ng/ml) of unlabeled insulin.
4. Lipogenesis
Lipogenesis from glucose was determined by the method of Moody et al.14). After fat cells had been incubated in a shaking water bath at 37°C for 90 minutes in a 1 ml medium containing D-glucose (0.05 nmol/1), 3-(3H-glucose 0.1 uCi and various insulin concentrations (0–380 ng/ml), (3H)-lipid was extracted into a toluene scintillant and counted by a Packard liquid scintillation spectrometer. Results were expressed as amounts of glucose (nmol) converted to toluene-extractable lipid in 90 minutes by 105 cells and plotted on the y-axis (Fig. 4).
Ability of adipocytes from each groups to convert the glucose to lipid.
RESULTS
1. Experimental Animals
Table 1. Summarizes the characteristics of the control and the hyperthyroid and the hypothyroid rats. As can be seen, the serum T3 and T4 levels of the hypothyroid group were lower than the value of the control (p<.005). The serum T3 and T4, levels of the hyperthyroid group were higher than the value of the control (p<.005).

Comparison of Serum T3, T4, Plasma Glucose and Insulin in Control, Hyperthyroid and Hypothyroid Rats
However, the serum insulin levels of the hyperthyroid and hypothyroid group were not different from the values of the controls. The blood glucose level of the hypothyroid group was higher than the values of the control or the hyperthyroid group (p<.005).
2. Insulin Binding
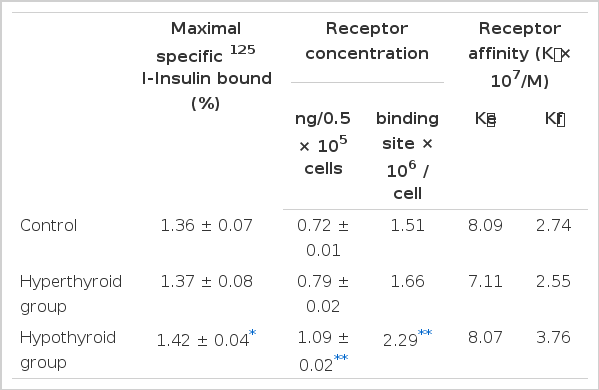
The competitive binding curves of 125I-insulin and unlabelled insulin to adipocyte from the hyperthyroid, the hypothyroid, and the control are shown in Fig. 1. The specific binding was taken as the difference between total and nonspecific binding. The specific 125I-insulin binding for all groups correlated negatively with the insulin concentration. The maximum specific insulin binding for the control, the hyperthyroid, and the hypothyroid group was 1.36 ± 0.07, 1.37 ± 0.08, and 1.42 ± 0.34 %, respectively (Table 2).
Competition-inhibition curves. The percent of total radioactivity specifically bound by adipocytes is plotted against total insulin concentrations (ng/ml). Values shown are mean ± S. D.
125I-Insulin Binding to Adipocytes of Rats
Scatchard plots15) of the data yielded the curvilinear plots characteristic of insulin binding (Fig. 2), at each insulin receptor concentration.
Scatchard plot. Percent bound-to-free insulin is plotted against total insulin bound to adipocytes specifically for the insulin concentrations from 0.1–100mg/ml. The receptor concentrations of each groups are the X-intercept of each curve.
Insulin receptor concentration per cell of the control, the hyperthyroid, and the hypothyroid group were 0.72 ± 0.01 ng/0.5 × 105 cells, 0.79 ± 0.02ng/105 cells and. 1.09 ± 0.02 ng/0.5 × 105 cells, respectively (Table 2).
The average affinity profiles16) calculated from the Scatchard plots were higher in the hypothyroid group compared with those of the control and hyperthyroid group in high receptor occupancy sites (Fig. 3). The average empty site (K̄e) and full site (K̄f) affinities calculated from the average affinity profiles were higher in the hypothyroid group (8.07 × 10⁷/M and 3.76 × 10⁷/M, respectively) compared with that of the control (8.09 ± 107/M and 2.74 ± 107/M, respectively), and that of the hyperthyroid group (7.11 × 10⁷/M and 2.55 × 10⁷/M) (Table 2).
The average affinities (K̄) were plotted against the log of the percent occupancy of the receptors (log Ῡ = log B/Ro × 100) at each point. The average empty site affinities (K̄e) were estimated when the value of Ῡ was zero. The average full site affinities (K̄f) were taken as the nadirs in affinity from the affinity profiles (when Ῡ = 1). Values shown are means.
3. Lipogenesis
To analyze one major pathway of glucose metabolism in the postreceptor level, the rate of glucose conversion to triglyceride was measured at various concentrations of unlabelled insulin (0–1,000 uU/ml) with adipocytes from the control, the hyperthyroid, and the hypothyroid rats. The lipogenesis was reduced, proportionately at all insulin concentrations in the hyperthyroid group versus the control group and more significantly reduced in the hypothyroid group. The insulin-induced lipogenesis increased proportionately as the insulin concentration increased and achieved maximal response at 160 uU/ml of insulin concentration (Fig. 4). The maximal lipogenesis in adipocytes from the hypothyroid and the hyperthyroid group were 32.3% (P<.05) and 63.4% (P<.005) of that of the control value.
4. Analytical Procedures
Serum glucose was determined using a glucose oxidase method. Serum insulin and T3 and T4 were determined by radioimmunoassay kits (Cambridge; Medical Diagnostics, Inc. U.S.A. and Daiichi Radioisotope Labs. Ltd., respectively).
The values of insulin binding, and lipogenesis expressed as the mean±SD in 3 separate experiments performed on different days. Comparisons were made using the Student’s t-test of statistical significance and differences accepted as significant at the P<.05 level. The cell suspension was diluted until it contained 0.5 × 10⁵ cells per ml. the viability of fat cells was assessed by the trypan blue dye exclusion test.
DISCUSSION
Thyroid hormones are known to influence carbohydrate metabolism, e.g., on glycolysis17) and gluconeogenesis18). Hyperthyroidism in man is often associated with elevated plasma glucose concentration17–20). And also it is frequently observed that glucose control becomes worse in diabetic patients who develop hyperthyroidism. However, the mechanisms underlying this influence are not known.
It has been reported that thyroid hormones decrease insulin secretion1). In vitro studies it has also been demonstrated that insulin secretion is decreased by stimulation of the B-adrenergic receptor or glucose in hyperthyroidism2,21–23). But, contradictory results have also been reported3,4,24,25), and decreased insulin secretion has been reported in hypothyroidism as well2). Accordingly, the influence of thyroid hormones on insulin secretion still remains controversial. However, recently it was suggested that thyroid hormones modify the effects of insulin action at the level of the target tissues4,34).
The purpose of the present study was to elucidate the mechanism of the effects of thyroid hormones on insulin action at the target tissue. Using isolated fat cells from experimentally induced hyperthyroid and hypothyroid rats, we examined insulin binding, insulin receptor number, insulin affinity and insulin-induced lipogenesis in the fat cell.
Monocyte and erythrocyte have been useful tools in studies of the insulin receptor26–29). However, it is well known that these are not classic target tissue for insulin. Accordingly, in a further attempt to document the alteration of insulin action at the target tissue, we have used isolated fat cells in this study. It is generally accepted that the fat cell is a valuable tool to investigate insulin binding and the biological activity of insulin at the intracellular level6,7,30–33). However, there are only a few reports about insulin action on fat cells in thyroid dysfunction and the results are controversial.
In the present study, we observed a significant increase in insulin binding to isolated fat cells in the hypothyroid rats (Fig. 1), and it was due to the increased insulin receptor number. But the value of insulin binding in hyperthyroid rats was not different from the value in control rats. These results are different from the recent report of Arner et al.34). Who demonstrated decreased insulin binding and insulin receptor concentration in hyperthyroidism. With regard to the insulin receptor, there are different results: increased insulin receptors in hypothyroidism36). It is postulated that such conflicting results may be due to the different methods and materials in each study. The insulin level was not changed in the hyperthyroid and hypothyroid rats in this study; accordingly, insulin can not be the cause of changes in insulin receptor number by the up or down regulation mechanism37).
It is suggested that the thyroid hormone directly regulates the insulin receptor number, possibly by alteration of the synthesis or degradation of the receptor. But in the present study, we are not able to demonstrate the evidence that thyroid hormones can control the synthesis or degradation of the insulin receptor. However, this study showed increased insulin receptor number in hypothyroidism and no change of insulin receptor number in hyperthyroidism. This finding suggests that insulin receptor number may be affected by the concentration of thyroid hormones; further investigation on the relationship between the thyroid hormones and insulin receptor in the fat cell will be needed.
With regard to insulin-induced lipogenesis in the fat cell, we observed significantly decreased lipogenesis at all insulin concentrations used in the experiment in both the hyperthyroid and the hypothyroid rats. Laker and Mayes10) reported a decreased lipogenesis in the hypothyroid liver. This result is similar to ours, however, it is difficult to compare to our datas because Laker and Mayes did not perform an insulin receptor assay in hypothyroidism, and a lipogenesis study in hyperthyroidism.
Our data suggest that thyroid hormone may modify not only the insulin receptor number, but also the intracellular biologic action of insulin; and the existence of a receptor defect in both hyper- and hypothyroidism. The results lead to the conclusion that thyroid dysfunction affects the postreceptor pathway of glucose metabolism in fat cells. The mechanism of the effects of thyroid hormones on insulin-induced lipogenesis in fat cells cannot be demonstrated in this study. However, it could be suggested that thyroid hormones may influence the intracellular enzyme or enzymes for regulating lipogenesis in the fat cell by the mechanisms of synthesis or degradation and/or increase or decrease its activity. By this mechanism, the cause of decreased lipogenesis in hypothyroidism can be explained.
In a several previous investigations, it has been demonstrated that thyroid hormones modulate the activity of cyclic AMP, phosphodiesterase38), adenylate cyclase39) in fat cells, and the enzymes related to carbohydrate metabolism in hepatocytes18). Thus, further evaluations of the enzyme or enzymes which relate to carbohydrate metabolism will be needed to confirm the mechanism of our results.
In summary, the present studies demonstrated that thyroid hormones may regulate the concentration of insulin receptor, and that thyroid dysfunction reduces insulin induced lipogenesis at the postreceptor level in fat cells.