Analyses of RBC Insulin Receptor Bindings in Chronic Liver Disease†
Article information
Abstract
125I-insulin binding to erythrocytes was measured to evaluate the role of insulin receptors in the mechanism of insulin resistance in partients with chronic liver disease (CLD). Patients with CLD were divided into two groups by the fasting plasma glucose level (FBS) and the glucose disappearance rate (k-glucose) during intravenous glucose tolerance tests: one with normal FBS and normal k-glucose (group I), and the other with higher FBS and lower k-glucose (group II). Insulin receptor bindings were reduced in group I patients compared with those of normal controls, but were not reduced in group II patients. Fasting insulin levels were significantly higher in group I patients than those in normal subjects, and down-regulation by hyperinsulinemia might be the cause of reduced insulin receptor bindings in these patients. However down-regulation of insulin receptors was not associated with glucose intolerance. So it is suggested that insulin resistance in CLD is not due to a primary defect of insulin receptors in peripheral tissues, and down-regulation of insulin receptors is an epiphenomenon of hyperinsulinemia.
INTRODUCTION
Insulin resistance and abnormal glucose tolerance are frequently observed in chronic liver disease (CLD), but the precise mechanism leading to insulin resistance still remains unclear1–3). In an attempt to explain the mechanism of insulin resistance in these patients, several investigators have studied insulin receptor bindings in patients with CLD4–7). However, the results are varied, and there remain controversies about the insulin receptor status in CLD.
Some studies have shown that insulin receptor bindings were reduced in CLD which suggested an insulin receptor defect as a primary cause of insulin resistance4–5). However, other studies reported that insulin receptor bindings were normal6), or even increased7) in patients with CLD, thus raising doubt about the above explanation.
The present study was performed to elucidate this controversy by observing the insulin receptor status of erythrocytes in patients with CLD. Although it is not clear whether erythrocytes reflect the insulin receptor status in more relevant tissues such as liver and muscle, it is generally agreed that insulin bindings to erythrocytes and monocytes change in a parallel direction in many situations8).
MATERIALS AND METHODS
The studies were carried out in eleven patients with CLD and in ten healthy subjects.
The patient group was composed of nine men and two women (age distribution; 25–64 years of age, mean; 45). Eight patients had liver cirrhosis and three had chronic active hepatitis. They did not take any medications that might influence glucose intolerance, and evidence of recent gastrointestinal bleeding was absent. Serum creatinine, urea nitrogen and electrolytes were normal.
Control group was composed of 10 healthy men (age distribution; 33–60 years of age, mean; 43). who showed no evidence of hepatobiliary, renal or endocrine disturbances. None had a family history of diabetes mellitus.
Intravenous glucose tolerance test (IVGTT) was performed after 25g of glucose was infused into an antecubital vein. Patients with CLD were divided into two groups by fasting plasma glucose levels (FBS) and the results of IVGTT. Group I was composed of 6 patients with FBS less than 100 mg/dl and normal glucose disappearance rate (k-glucose), and group II was 5 patients with higher FBS (FBS>100 mg/dl) and lower k-glucose values (Table 1).
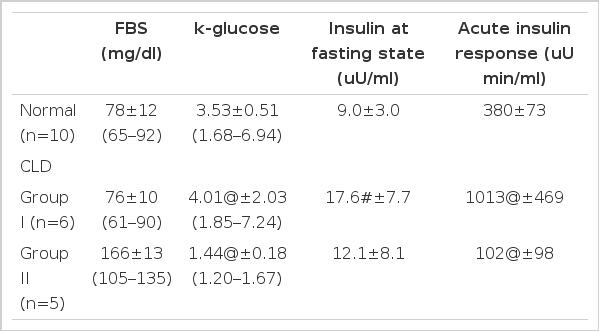
Summary of the Glucose and Insulin Data in Fasting State and during IVGTT in Normal Subjects, Group I and Group II Patients with CLD
Glucose disappearance rate (k-glucose) was calculated according to the formula of Amatuzio et al.19) as follow;
The reticulocyte count in peripheral blood was performed in all of the samples. Those with over 1% reticulocytes were discarded as reticulocytes were known to have insulin receptors of more than tenfold compared with those of more matured red cells9).
INSULIN BINDING STUDY
Insulin binding to erythrocytes was studied in duplicate according to the method of Gambhir with some minor modifications as previously described10–11).
Twenty milliliters of overnight fasting blood was drawn into a heparinized syringe and the erythrocyte cell layer was separated by Ficoll-Hypaque gradient centrifugation method. The cell suspension, trace amounts of radioactive insulin [125I-A14-monoiodinated human insulin with specific activity of about 2000 Ci/mmole (Amersham Co., England)]12), and various concentrations (0.02 to 105 ng/ml) of unlabeled insulin were incubated at 15°C for 3 and 1/2 hours. The bound form of insulin was separated and the radioactivity was counted in a gamma counter.
The nonspecific binding was defined as the radioactivity in the presence of 105 ng/ml of unlabeled insulin. The nonspecific binding was subtracted from the total binding and the results were expressed as specific 125I-insulin binding to erythrocytes of a concentration of 4.0×10⁹ cells/ml.
The results of the binding studies were presented as; (1) the specific binding of 125I-insulin in the absence of competing unlabeled insulin, % (B/T)0, (2) the specific cell bound fraction plotted as a function of total insulin concentrations (competition curve), and (3) The ratio of the cell-bound insulin to bee insulin plotted as a function of cell-bound insulin (Scatchard plots)13). In the Scatchard plots, the highest insulin concentrations used was 100 ng/ml14). The binding data were analyzed on the assumption that the curvature of the Scatchard plots reflects the presence of two populations of insulin binding sites (high affinity receptors and low affinity receptors)15).
STATISTICAL ANALYSIS
Data in tables are given as mean±S.D., and data in figures as mean±S.E.M.. The statistical analysis of the data was performed using the unpaired t-test.
RESULTS
Fig. 1 shows the mean competition curves for 125I-insulin binding to erythrocytes in three study groups. The percent specific binding in the absence of unlabeled insulin was significantly lower in the group I patients compared with that of the normal subjects. However, 125I-insulin binding to erythrocytes in group II patients was very similar to that of the normal subjects.
125I-insulin binding curves to erythrocytes in normal subjects, group I and group II patients with chronic liver disease.
The Scatchard plots of the mean values at each concentration of the bound insulin in three groups are shown in Fig. 2. Apparent receptor numbers of both high and low affinity receptors tended to be lower in the group I patients than those in normal controls, but the statistical differences of these indices between two groups (group I and normal controls) were not significant probably due to the small size of the samples (Table 2). Scatchard plot in group II patients were almost identical to that of normal subjects.

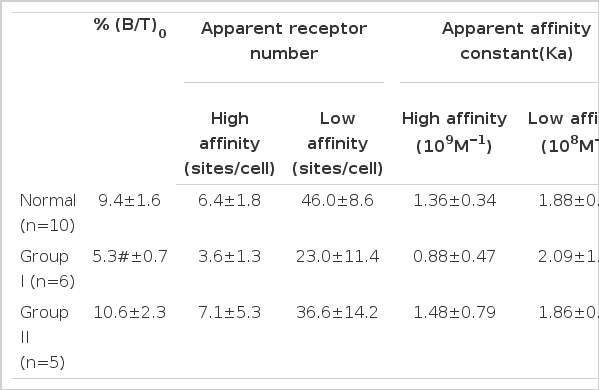
Insulin Binding Parameters in Normal Subjects, Group I and Group II Patients with CLD
DISCUSSION
There seem to be at least two subgroups of patients in CLD: one with normal FBS, normal k-glucose and brisk insulin response to intravenous glucose loading (group I), and the other with higher FBS, lower k-glucose and blunted acute insulin response to glucose loading (group II)16)(Table 1).
Present study clearly demonstrates that erythrocyte insulin receptor binding is also different between these two groups of patients. Insulin binding to erythrocytes was reduced in group I patients, but was not reduced in group II patients. This was quite surprising since if the primary cause of insulin resistance was the defect of insulin receptors in peripheral tissues, those patients with reduced insulin receptor binding would have more abnormal glucose tolerance than those with normal insulin receptor binding. This was not true in the present study, and it was suggested that insulin resistance in CLD might not be due to a primary defect of insulin receptors.
Reduced insulin receptor binding is frequently associated with many states characterized by insulin resistance and hyperinsulinemia, such as obesity, type II diabetes mellitus and acromegaly17). CLD is another state frequently associated with glucose intolerance, insulin resistance and hyperinsulinemia, and several investigators have reported that insulin receptor bindings to peripheral tissues are reduced in the patients with CLD. It has been believed that down-regulation of insulin receptor by hyperinsulinemia is the cause of insulin resistance in CLD4,5).
However, contradictory results have also been reported. Proietto et al6), have shown that insulin receptor binding was not altered in the patients with CLD, Okada7) reported that insulin binding was rather increased in the patients with CLD, and that the degree of increase was more marked in the patients who also had diabetes mellitus. The cause of the discrepancy is not clear. The result of the present study suggests that the discrepancy might be due to the differences in the study populations.
In the present study, fasting insulin levels in group I patients were significantly higher than those in normal subjects (Table 1.), and down-regulation by hyperinsulinemia might be the cause of reduced insulin receptor binding in these patients (Table 2.). However, down-regulation of insulin receptor was not associated with glucose intolerance (group I), and erythrocyte insulin receptor binding was almost normal in the patients with glucose intolerance (group II).
The biological significance of this phenomenon is not clear at present, and indeed it is not clear whether the observed changes in insulin binding to erythrocytes in CLD correlate with the changes in insulin binding to insulin sensitive tissues. Some investigators still believe that reduced insulin receptors in hepatic tissues may be the primary cause of insulin resistance in patients with CLD18).
However, no such direct evidence has been demonstrated until now, and at least erythrocyte insulin receptors are concerned, down-regulation of insulin receptors seems to be an epiphenomenon of hyperinsulinemia and might not be very important in the genesis of insulin resistance in these patients.