Postprandial 2-hr C-peptide Concentration as a Guide for Insulin Treatment in Patient with NIDDM
Article information
Abstract
To determine the usefulness of postpradial-2hr serum C-peptide as a guide for insulin treatment in NIDDM, the 67 NIDDM patients admitted in Kyung Hee University Hospital from Nov. 1981 to May 1984 were classified according to postprandial 2-hr insulin, C-peptide levels and 24-hr urine C-peptide levels.
The patients were divided into 3 groups according to the level of insulin or C-peptide in normal persons reported previously.9)
In 22 patients with postprandial 2-hr values of more than 5.8 ng/ml for C-peptide, 12 patients (55%) were diet controllable and only 5 patients (22%) required insulin treatment. On the other hand, in the classification according to postprandial 2-hr insulin or 24-hr urine C-peptide levels, higher response groups should be controlled by diet alone, but 9 of 18 patients (50%) for insulin, 8 of 14 patients (57%) for 24-hr urine C-peptide required insulin treatment.
The classification according to postprandial 2hr C-peptide levels was a more sensitive guide for insulin treatment than that with postprandial 2hr insulin level or 24hr urine C-peptide level.
INTRODUCTION
In the past decades it had been asserted that glucose intolerance in NIDDM patients can arise from several causes. Numerous accumulated evidences support the notion that insulin resistance and decrease of insulin secretory capacity are the major causes of glucose intolerance in NIDDM.1–5)
Although the majority of NIDDM patients has normal or increased serum insulin concentration and 24-hour urinary C-peptide excretion,6) many of them require insulin therapy in practice without any improvement by diet therapy and oral hypoglycemic agents. Many factors are taken into consideration to use insulin such as degree of blood glucose elevation, history of actual ketosis, relative body weight, complications, duration of disease, success or failure of the previous treatment modalities. However, there has been no useful criteria for the insulin therapy before one begin to start diet therapy and oral hypoglycemic agents.
Turkington et al.7) reported that the patients with peak value of less than 60μU/ml for serum insulin concentration or less than 6.0 ng/ml for serum C-peptide concentration during oral glucose tolerance test did not normalize the blood glucose concentration after weight reduction and required an additional oral hypoglycemic agent or insulin. Rendell et al.8) advocated that patients with fasting and glucose stimulated plasma C-peptide values similar to those in normal subjects were diet-controlable diabetes.
To determine whether postprandial 2hr serum C-peptide level is useful indicator for insulin treatment in NIDDM, we performed the retrospective analysis of several clinical characteristics according to the classification by postprandial 2hr serum insulin, C-peptide level and 24-hour urinary C-peptide excretion.
SUBJECTS AND METHODS
Subjects were 67 patients (37 male and 30 female) with NIDDM admitted from February, 1981 to May, 1984, in Kyung Hee University Hospital.
They were aged from 31 to 76 years and free from renal failure. Blood glucose was measured by glucose oxidase method, HbA1c by column method and plasma insulin and C-peptide were measured by radioimmunoassay (Daiichi radioisotope laboratories). All patients were classified in three ways by serum insulin, C-peptide, 24-hr urine C-peptides and reclassified into 3 groups (Table 2) on the basis of normal values which we reported previously (Table 1).9) Group 1 of each classification had values above 1 S.D of mean and group 3 had values below 1 S.D of mean.

Grouping of the subjects according to the level of serum insulin, serum C-peptide and 24hr urinary C-peptide
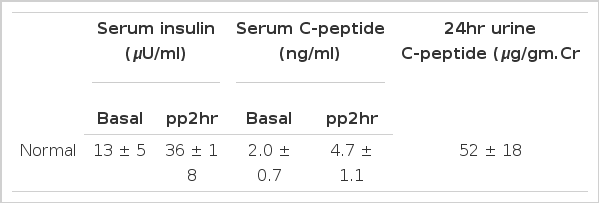
Serum insulin, serum C-peptide and 24hr urinary C-peptide in normal subjects (n = 11)*
RESULTS
1. Clinical and laboratory findings
In each group classified according to the postprandial 2-hr serum insulin level (Table 3). The higher response group of insulin (group I1) was more obese than the lower response group (group I3). Their weight indices were 1.13 ± 0.14, 0.98 ± 0.12 respectively. Fasting blood sugar and HbA,c were low in group I1, significantly. (p<0.005) The incidence of diabetic complications was lower in group I1, (13%) than in group I3 (43%).
In the classification according to the level of postprandial 2-hr serum C-peptide (Table 4). There were similar results to the classification according to insulin level but more significant discrimination between two groups, (group C1, C3).
In the classification according to the level of 24-hr urine C-peptide (Table 5). The higher response group (group U1) was more obese than the lower response group (group U3), (p<0.005). Their weight indices were 1.13 ±0.15, 0.97 ± 0.12 respectively. Fasting blood sugar was lower in group U1, (188.5 ± 85.6) than in group U3 (272.9 ± 81.5 mg/dl). The incidence of diabetic complications was lower in group U1 (9%) than in group U3 (62%). When these results were compared with the above results by the classification according to the level of postprandial 2-hr serum C-peptide, the incidence of diabetic complications had no difference but fasting blood sugar and HbA1c presented more significant difference in the classification according to postprandial 2-hr serum C-peptide level.
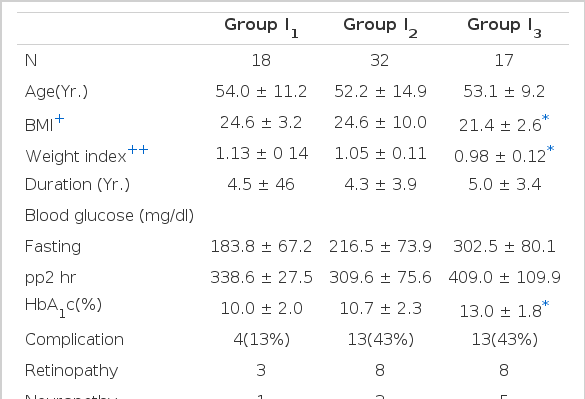
Clinical and laboratory findings in each group classified according to the postprandial 2-hr serum insulin level

Clinical and laboratory findings in each group classified according to the postprandial 2-hr serum C-peptide level
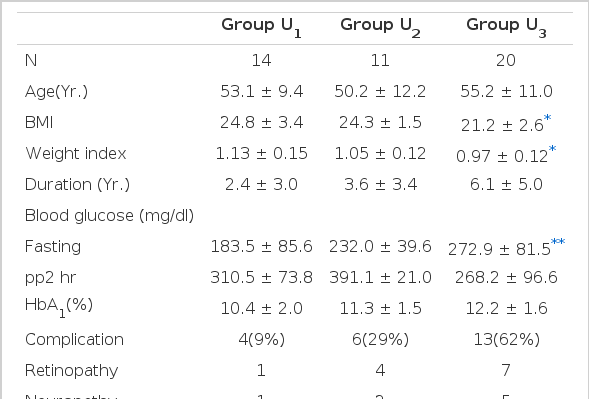
Clinical and laboratory findings in each group classified according to the 24-hr urinary C-peptide level
2. Changes in the mode of treatment during the initial and final phase of the admission in each group
In the classification according to the level of postpradial 2-hr serum insulin (Table 6). Diet-controllable diabetic patients (pp2hr blood sugar; less than 200 mg/dl) were 6 (33%) in group I, but zero in group I3. Remarkably, one patient in group I1, was receiving insulin on admission but was able to control by diet, only on discharge. The patients receiving insulin on discharge were 9 (50%) in group I1, 17 (100%) in group I3.
In the classification according to the level of postprandial 2-hr serum C-peptide, (Table 7). Diet-controllable diabetics were 12 (55%) in group C1 but zero in group C3. The Diabetics receiving insulin on discharge were 5 (22%) in group C1, 29 (97%) in group C3.
In the classification according to the level of 24-hr urine C-peptide (Table 8). Diet-controllable diabetics were 4 (29%) in group U1, but none in group U3. The diabetics receiving insulin on discharge were 8 (57%) in group U1, 19 (95%) in group U3.

Changes in the mode of treatment during the initial and final phase of admission in each group, classified according to the level of postprandial 2-hr serum insulin
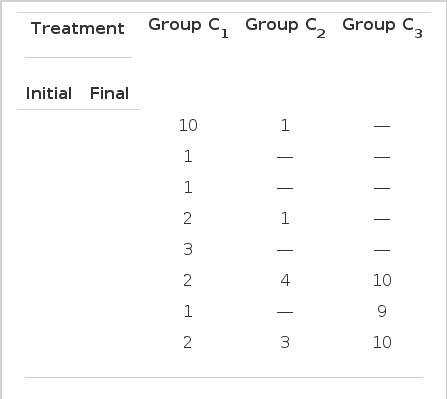
Changes in the mode of treatment during the initial and final phase of admission in each group, classified according to the level of postprandial 2-hr serum C-peptide

Changes in the mode of treatment during the initial and final phase of admission in each group, classified according to the level of postprandial 2-hr urinary C-peptide
At the point, diet-controllable diabetics may be present higher response (such as group I1, C1, U1,) than diabetics requiring additional treatment one would think that the classification according to the level of postprandial 2-hr serum C-peptide is a more sensitive index for insulin treatment than other classifications.
DISCUSSION
Diabetes consisted of juvenile-onset diabetes and adult-onset diabetes in past years, but several inconsistencies were indicated in this classification.
At present, diabetes are classified into three groups; IDDM, NIDDM, secondary diabetes according to the propose by national diabetes Data group in 1973.10)
IDDM is almost always characterized by a nearly total absence of endogenous insulin secretion from pancreatic β-cells and caused by an inflammatory process, so called insulitis.
Genetics11–13) and viral infections14–15) are thought to play important etiologic roles in its pathogenesis. Therefore, all insulin dependent diabetics require insulin to sustain life because of proneness to ketosis and severe hyperglycemia.
In contrast, NIDDM has no defects in insulin secretion from pancreatic β-cell and may results from a specific receptor or post-receptor defect namely, insulin resistance in target tissues of insulin.
Since Yallow et al.17) reported the methods employed in the immunoassay of endogenous insulin in 1960, these facts become more clear. Therefore, the principle of treatment is a removal of the causes of insulin resistance. For the treatment of diabetes, it has no disagreement that insulin therapy is mandatory for the treatment of IDDM. Because the pathogenic mechanism of NIDDM is insulin resistance and level of insulin in patients with NIDDM are normal or increased, the patients with NIDDM do not need insulin for treatment theoretically. However, many patients are treated with insulin in practice. A few modalities for treatment are applied to patients with NIDDM, diet only, diet and oral hypoglycemic agent, diet and insulin.
And yet, diet therapy remains the most important method for treatment of NIDDM because weight reduction by diet improves insulin resistance and restores the sensitity of tissues to insulin. In practice, a physician has to use insulin in the patient whose blood sugar has not been controlled by diet therapy and oral hypoglycemic agents.
Therefore, there occurs a question how we predict one to need the insulin thereapy before starting diet therapy and oral hypoglycemic agent. Turkington et al.7) published that patients with peak values of less than 60 μU/ml for insulin or less than 6.0 ng/ml for C-peptide induced during oral glucose tolerance testing did not normalize the blood sugar concentration after weight reduction and required additional oral hypoglycemic agent or insulin. Rendell et al.8) advocated that patients with fasting and glucose-stimulated plasma C-peptide values similar to those in normal subjects were diet-controllable diabetes and others needed oral hypoglycemic agents or insulin. In another study,18) they reported that insulin secretory capacity was measured by C-peptide responsle during a standard oral glucose tolerance test in patient who achieved normalization of plasma glucose level only by dietary regimen.
Summed C-peptide levels of the diabetics controlled by diet therapy was higher than for normal weight, nondiabetic volunteers. Beischer et al.19) asserted that the response of immunoassayable C-peptide to an intravenous glibenclamide-glucose load in diabetics was useful index in order to predict which patients would be manageable with glibenclamide tablets and which would require insulin. Madsbad et al.20) contended that serum C-peptide concentration measured 6 minutes after an I.V. injection of 1 mg glucagon seemed to be of value in the out patient clinic to discriminate non-insulin dependent from insulin-dependent patients.
The above reporters performed prospective study but we did a retrospective study and discovered similar results with them. We measured the post-pradial 2-hr response of insulin or C-peptide because diabetics present the peak response about 2-hr after meal, which is different from peak response about 30–60 min in normal subjects.21) In addition, we measured the 24-hr urine C-peptide in order to determine a more precise index for insulin treatment.
In the classification according to the level of postprandial 2-hr serum C-peptide and 24-hr urine C-peptide, (Table 7, 8) diet-controllable diabetics were 12 (55%), 4 (29%) in higher group (C1, U1,) respectively and insulin needed diabetics were 29 (97%), 19 (95%) in lower group (C3, U3) respectively. 12 (55%) in the higher response group (C1) was controlled by diet. Especially, one who was diagnosed as CVA was controlled by insulin transiently after admission and then, by diet after discharge. It was believed that CVA, one acute stress could aggravate glucose intolerance transietly in this patient. Nondiet-controllable diabetics in group C1 were 10 (45%), 5 of them required insulin therapy. By previous reports7,8) they should be controlled by diet only. One had pulmonary tuberculosis. Two had no specific diseases and required daily 30 U, 40 U of insulin on admission and reduced to 20 U, 12 U 3 months, 5 months later respectively. Rest one was a patient with CVA and required 60 U of insulin on admission. But we also expect that the dose of insulin will be decreased in near future. Therefore, we could get the result that the classification according to postprandial 2-hr serum C-peptide is a more sensitive indicator for the requirement of insulin therapy than that according to 24-hr urine C-peptide. The reason why the 24-hr urinary C-peptide was less sensitive may arise from the fact that postprandial 2-hr serum C-peptide reflects secretory response of insulin newly synthesized from pancreatic β-cell after mixed meal, but 24-hr urine C-peptide reflects the total insulin secretory capacity of pancreatic β-cell throughout meal, emotional stress, and other during all the day.
Turkington et al.22) published the results of their study as follows: In glucose tolerance test (100g) characterized by measurement of induced insulin secretion, diabetic complication of retinopathy, sensory neuropathy and renal disease developed only in the group of patients that the induced serum insulin peak fell below 60μU/ml and who showed greater than this were not associated with development of these complications. They suggested that a critical amount of insulin secretory reserve could distinguish the qualitatively distinct clinical syndrome, true diabetes from the syndrome of pure resistance to insulin. Our results were similar to theirs.
Most diabetics needed insulin therapy had more frequent diabetic complications and lower level of postprandial 2-hr serum insulin, C-peptide and 24-hr urine C-peptide. In conclusion, to predict the diabetics need insulin therapy, the duration of diabetes mellitus, presence of diabetic complications, degree of sugar elevation, and failure of previous treatment modalities are important factors but the level of postprandial 2-hr serum insulin and C-peptide, 24-hr urine C-peptide are more important factors. Among them, the classification according to postprandial 2-hr C-peptide level is a most sensitive guide for insulin treatment.


