


INTRODUCTION
International consensus guidelines1ŌĆō3) have recommended measurements of the forced expiratory volume in one second (FEV1) or peak expiratory flow (PEFR) to assess the severity of airflow obstruction. Although the FEV1 is the single best measure for assessing the severity of airflow obstruction, the PEFR is a simple, reproducible measure that correlates well with the FEV11). And spirometry is a measurement that is not available to the majority of physicians treating patients with asthma. Therefore, the British guideline4) concentrates on PEFR, giving a chart of predicted normal values, and the international guidelines1ŌĆō3) suggest that PEFR is an alternative to FEV1 when expressed as % of predicted normal values.
However, several investigators5ŌĆō7) have demonstrated that there is a considerable disagreement between FEV1 and PEFR in estimating the degree of airway obstruction. FEV1 provides an integrated measurement of airflow from both large and peripheral airways and PEFR is a measure of large airways function8). The obstructive lung diseases, such as asthma and emphysema, usually show an ŌĆśairway collapseŌĆÖ type of the maximal expiratory flow volume curve, resulting in an FEV1 disproportionately lower than PEFR9). In addition, it is known that when an asthma attack resolves, the airways obstruction reverses first in the large airways and then in the more peripheral airways10). Since FEV1 and PEFR values are not equivalent, Sawyer et al.7) suggested that the published guidelines should avoid the assumption of parity between the two measurements. Although Sawyer et al.7) demonstrated the non-equivalence very well, they did not discriminate inter-instrumental variation from intrinsic difference of the two measurements. And, as far as we know, there is still no study reporting any difference between FEV1 and PEFR obtained with PEFR meter sequentially following a commencement of therapy in acute asthma.
This study demonstrates a marked difference between FEV1 and PEFR in sequential manner during acute asthma treatment and discloses the relative roles of the possible factors contributing to the difference.
MATERIALS and METHODS
The study subjects consisted of 35 consecutive patients (18 females, 17 males; mean age 51.7 years, range 22ŌĆō73) who visited the emergency room (ER) of Chonnam National University Hospital, Gwangju, Korea (the altitude: 70 m) due to acute severe asthma over approximately a four-month period. FEV1 and PEFR were measured on presentation, one hour after initial treatment, and 1, 3, 5, 7 days later. FEV1 and PEFR were measured by using a Fleisch pneumotachograph (Spiro Analyzer ST-250; Fukuda Sangyo, Tokyo, Japan), and a PEFR was additionally measured with a Ferraris PEFR meter (Pocketpeak┬« peak flow meter; Ferraris Medical, Inc., CA, USA). Each patient performed the tests with techniques that meet standards developed by the American Thoracic Society (ATS)11). All the patients showed a reduced ratio of FEV1/FVC (<65%) indicating airflow obstruction.
The severity of airflow obstruction was evaluated by comparison of the patientŌĆÖs results with the predicted values for FEV1 developed by Crapo et al.12) and for spirometric PEFR by Knudson et al.13) because the instruction manual for spirometry provided by the manufacturer of the spirometer denotes them as the predictive equations recommended by the Intermountain Thoracic Society. In accordance with the recommendation by the manufacturer of Ferraris PEFR meter, we used the predictive equations developed by Leiner et al.14). For secondary analyses, measurements of FEV1 were expressed as a % of predicted values, using predictive equations developed by Knudson et al.13) and Kim et al.15) and PEFR by Nunn & Gregg16) and Kim et al.17). The mean differences and the ŌĆślimits of agreementŌĆÖ in the paired measurements of FEV1 and PEFR were calculated. The ŌĆślimits of agreementŌĆÖ (mean┬▒standard deviation├Ś1.96) were calculated using the methods of Bland and Altman18).
The international guidelines1,3) state that severity of asthma exacerbation is classified on the basis of FEV1 or PEFR measurements of >80%, 50ŌĆō80%, <50% of predicted or personal best values and the British guideline4) defines a PEFR <33% of predicted or best as life-threatening attack of asthma. Therefore, the severity of airflow obstruction was classified as mild, moderate, severe and life threatening when the FEV1 or PEFR is >80%, 50ŌĆō80%, 33ŌĆō50%, and <33% of predicted values in this study.
Data were expressed as mean┬▒SEM. Comparisons of the measurements between FEV1 and PEFR at each time point were made using the StudentŌĆÖs t-test for paired values. PearsonŌĆÖs correlation was used to examine the relationships between FEV1 and PEFR. And comparisons of asthma severity between FEV1 and PEFR were made by using Wilcoxon matched-pair signed-ranks test and McNemar test. A probability value of less than 0.05 was considered statistically significant.
RESULTS
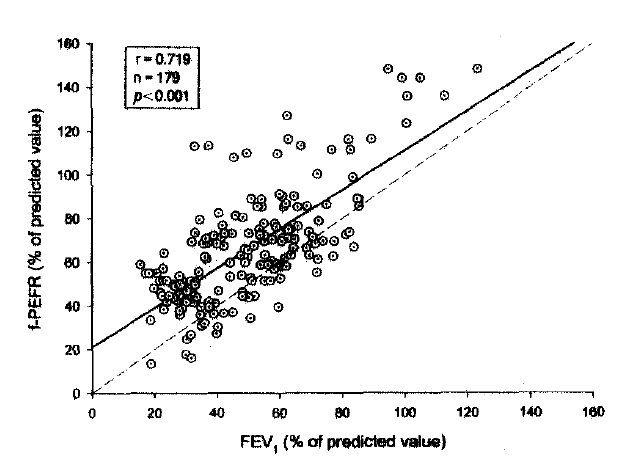
On ER presentation, all patients could get PEFR values by using the Ferraris PEFR meter (f-PEFR), but 4 patientsŌĆÖ airflow obstructions were so severe as to prevent performance of a forced vital capacity (FVC) maneuver to get FEV1. There was a significant relationship between the 179-paired measurements of FEV1 and f-PEFR expressed as % predicted values (r=0.719, p<0.001). However, there was a considerable skew in distribution of measurements toward the PEFR axis (Figure 1).
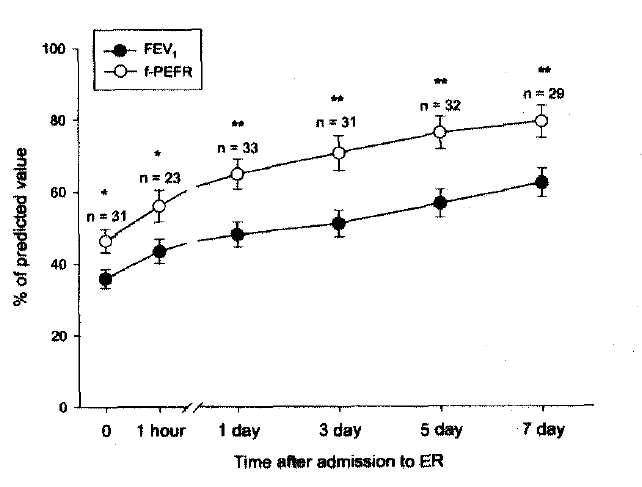
And the mean values (┬▒SEM) of measurements expressed as % predicted were significantly higher in f-PEFR than those in FEV1 at each time point (46.4┬▒3.3% vs. 35.9┬▒2.6% at 0, 56.1┬▒4.4% vs. 43.5┬▒3.4% at 1 hour, 64.9┬▒4.1% vs. 48.1┬▒3.5% at 1 day, 70.6┬▒4.9% vs. 51.2┬▒3.7% at 3 day, 76.2┬▒4.5% vs. 56.7┬▒3.9% at 5 day, 79.3┬▒5.0% vs. 62.3┬▒4.0% at 7 day, p<0.01, respectively; Figure 2). The mean difference of measurements in total was 16.1┬▒1.4% between FEV1 and f-PEFR.
Because FEV1 is quite reproducible, has a relatively narrow normal range and reflects the clinical severity of the disease, it is used widely in clinical practice as the representative parameter to indicate the severity of airflow obstruction. Therefore, we considered FEV1 as the true value of lung function and measured the difference of f-PEFR against this true value (Figure 3). The limits of agreement for f-PEFR were unacceptably wide (ŌłÆ20.0ŌĆō52.3% in total).
The airflow obstruction on presentation was mild in 3.2%, moderate in 29.0%, severe in 58.1% and life-threatening in 9.7% of patients when f-PEFR was used for the classification of severity, while mild in 0%, moderate in 22.6%, severe in 22.6% and life-threatening in 54.8% when FEV1 was used, which was significantly different (p<0.01). The classification differences in total were also significant (p<0.001, Table 1).
The discrepancy was inter-instrumental in large part. The mean differences were 16.1┬▒1.4% between FEV1, and f-PEFR, 10.1┬▒1.4% between f-PEFR and spirometric PEFR (s-PEFR) and 6.0┬▒1.4% between s-PEFR and FEV1 (Table 2). The mean values of f-PEFR were significantly higher than those of s-PEFR at each time point except 1 hour (45.3┬▒3.8% vs. 39.0┬▒3.3%, 57.4┬▒5.9% vs. 50.2┬▒4.5%, 64.6┬▒5.6% vs. 50.9┬▒5.7%, 74.8┬▒6.4% vs. 65.0┬▒5.8%, 77.0┬▒8.2% vs. 67.0┬▒8.0%, 85.6┬▒9.6% vs. 75.2┬▒8.1%; p<0.05, respectively, except no significance at 1 hour). The actual values of f-PEFR were 19.2┬▒1.6% higher than s-PEFR (Table 2, Figure 4). The mean values of s-PEFR were not significantly different from those of FEV1 except p<0.01 at 3 day (39.2┬▒3.5% vs. 35.5┬▒2.6%, 51.1┬▒4.7% vs. 46.2┬▒4.5%, 50.3┬▒5.9% vs. 47.7┬▒4.6%, 63.0┬▒6.2% vs. 52.7┬▒5.6%, 67.0┬▒8.0% vs. 59.6┬▒6.5%, 76.6┬▒7.6% vs. 67.3┬▒6.9%). However, the difference in the classification of severity of airflow obstruction between FEV1 and s-PEFR was significant in total (p<0.05, Table 1).
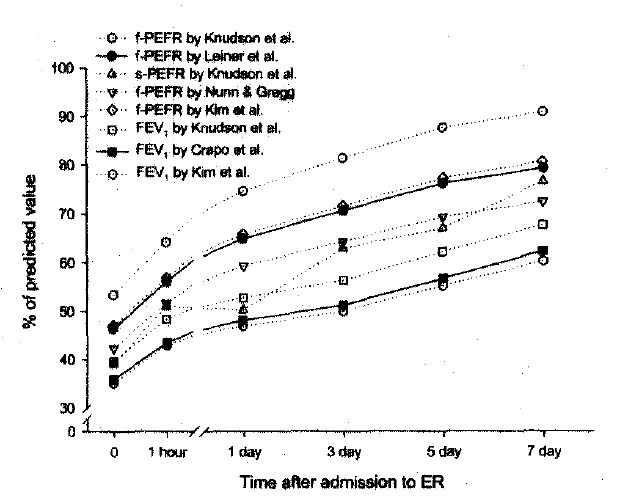
The use of other predictive equations altered the degree of the differences but could not completely correct it. The Korean equations by Kim et al.15) for FEV1 and by Kim et al17) for PEFR gave a bigger difference (18.3┬▒1.5%). The predicted value for FEV1 calculated by using the equations by Crapo et al.12) was higher than that by Knudson et al.13) and the value for PEFR by Leiner et al.14) lower than that by Nunn & Gregg16). As a consequence, the mean difference of the 179 paired measurements was biggest between f-PEFR by Leiner et al.14) and FEV1 by Crapo et al.12) (16.1┬▒1.4%) and decreased to 11.2┬▒1.4% using the equation by Knudson et al.13) for FEV1, to 10.4┬▒1.4% by Nunn & Gregg16) for f-PEFR and to 5.5┬▒1.5% by Nunn & Gregg16) for f-PEFR and by Knudson et al.13) for FEV1 (Table 2). However, the lowest difference by Nunn & Gregg16) for f-PEFR and by Knudson et al.13) for FEV1 also gave a significant difference in the classification of severity of airflow obstruction between FEV1 and f-PEFR in total (p<0.01, Table 1). The difference from FEV1 was negligible (0.4┬▒1.4%) only when PEFR was obtained with spirometry and expressed by using KnudsonŌĆÖs equations13) for both (Table 2, Figure 4).
DISCUSSION
The f-PEFR correlated well with the FEV1 but, there was a considerable disagreement between FEV1 and f-PEFR is estimating the degree of airflow obstruction, which is consistent with previous studies5ŌĆō7). Sawyer et al.7) demonstrated that PEFR measured using Wright PEFR meter was higher than spirometric FEV1, with a mean difference of 17.2% which is consistent with our mean difference of 16.1% and suggested that the current international consensus guidelines should be revised to indicate that measurements of FEV1 and PEFR are not equivalent when expressed as % predicted values.
The wide limits of agreement (ŌłÆ20.0ŌĆō52.3%) were not acceptable because ATS11) recommends that the instrument must measure PEFR within an accuracy of ┬▒10% of reading or ┬▒18 L/min, whichever is greater. Assessment of severity of airflow obstruction was significantly different between both measurements, which is consistent with the results by Sawyer et al.7). Because the international guidelines1ŌĆō4) state that the intensity of treatment should tailor to the severity of the exacerbation, many patients with acute asthma may receive an undertreatment if their exacerbations are judged only on PEFR values.
The EPR23) emphasizes that PEFR meters are designed as tools for ongoing monitoring, not diagnosis. At any time, there is a question about the validity of PEFR meter reading and PEFR values from the portable PEFR meter and from laboratory spirometry should be compared. Although the statements admit the fact that the PEFR measurements may be inaccurate, the EPR23) still states the asthma severity to be classified based on FEV1 or PEFR measurement. This study reconfirms the actual difference between FEV1 and PEFR measurements and arouses the necessity for the validity evaluation when PEFR is used for assessing severity of airflow obstruction in acute asthma.
In this study, the differences were primarily derived from the uses of different measuring instruments. PEFR measured with the Ferraris PEFR meter was 19.2% higher than that with the spirometer, which is consistent with the report by Miller et al.19) showing that the PEFR measurement with a Ferraris PEFR meter is higher up to 80 L/min than that with a Fleisch pneumotachograph at 360 L/min. Therefore, the measurements must be converted to % predicted values using the predictive equations suitable for each instrument to reduce this problem, and the difference could be reduced to about half (to 10.1%) by using the predictive equations developed by Leiner et al.14) for f-PEFR in accordance with the manufacturerŌĆÖs recommendation in this study. Unfortunately, the Leiner equations were made by using a Wright PEFR meter and so the values converted with the Leiner equations in this study may still over read as Miller et al.19) demonstrated that the PEFR measurement with a Ferraris PEFR meter was higher approximately 40 L/min than the PEFR measured with a Wright PEFR meter. Although it is well known that lung function depends on race, the Korean equations15,17) could not correct the difference in this study. As another contributing factor, Wensley et al.20) recently showed PEFR maneuver itself causing a greater PEFR value than FVC maneuver.
European Respiratory Society21) states that the reference values for PEFR have substantial differences between them and PEFR reference values derived from spirometric readings should not be applied to readings from PEFR meters. The present study also showed considerable differences among the predictive equations, and f-PEFR, expressed using predictive equation by Knudson et al.13) which was developed for spirometric PEFR, was most markedly deviated from FEV1 as expected. And the lowest difference was obtained by Knudson et al.13) for FEV1 and by Nunn & Gregg16) for f-PEFR. However, this difference still caused a significant alteration in the classification of asthma severity, and so the different predictive equations could not completely correct the discrepancy between FEV1 and PEFR.
Because FEV1 and PEFR represent function of airway portions different form each other8), PEFR may underestimate severity of airflow obstruction intrinsically. Moreover, the reversal of airflow obstruction in asthma begins from the large airways10). In this study, the mean differences between f-PEFR and FEV1 were increased progressively from 10.5% on presentation to 19.5% at 5 day, which is a consistent finding with the previous observations. However, s-PEFR was not significantly different from FEV1 when calculated by using the equations by Kudson et al.13) for both, and so the intrinsic difference between FEV1 and PEFR was not so much apparent.
Taken together, PEFR underestimated the severity of airflow obstruction in acute asthma and the discrepancy between FEV1 and PEFR was inter-instrumental in large part. Different predictive equations altered the degree of the differences but could not completely correct it. Therefore, these confounding factors should be considered when the severity of airflow obstruction is assessed with PEFR.

 PDF Links
 PubReader
 ePub Link
 Full text via DOI
 Download Citation
 Print
Print


