


INTRODUCTION
Aortic stenosis (AS) can increase cardiac pressure overload and cause left ventricular hypertrophy (LVH), which is the main compensatory mechanism in the early phase of the disease. Long-term left ventricle (LV) pressure overload provokes a decrease in myocardial perfusion pressure, eventually leading to subendocardial ischemia and consequent myocardial apoptosis and reactive perivascular and interstitial fibrosis in the extracellular matrix (ECM). Experimental banding of the ascending aorta in rodents is the most commonly used small animal model of AS [1]. Furthermore, the ascending aortic banding and subsequent debanding model can be used to examine reverse cardiac remodeling, such as aortic valve replacement [2-4].
Interstitial and perivascular fibrosis in the pressure overload model arise from T cells and macrophages that have invaded the adventitia of intramural coronary arterioles [5-7]. Once activated, normal fibroblasts differentiate into myofibroblasts, resulting in transforming growth factor-beta (TGF╬▓) expression stimulated by angiotensin II. TGF╬▓1, which is subsequently generated by myofibroblasts, induces the transcription of connective tissue growth factor (CTGF, CCN2). CTGF, a matricellular protein of the CCN family of proteins, is a key profibrotic factor that promotes the formation and activation of myofibroblasts and stimulates ECM deposition and tissue remodeling [8-10]. Furthermore, several studies have reported that inhibition of CTGF can reverse the process of fibrosis [9,11]. MicroRNAs (miRNAs) are single-stranded, highly conserved, small noncoding RNAs that bind to the 3ŌĆ▓-UTR of mRNA and regulate gene expression through translational repression and mRNA degradation.
In this study, we evaluated the expression of CTGF, TGF╬▓1, and matrix metalloproteinase-2 (MMP2) using enzyme-linked immunosorbent assay (ELISA), and we assessed miRNA-26b, miRNA-133a, and miRNA-19b in in vivo and in vitro models of reverse cardiac remodeling.
METHODS
Cell culture
Rat fibroblast Rat2 cells were purchased from American Type Tissue Collection (ATCC, Manassas, VA, USA). Cells were maintained in RPMI supplemented with 10% fetal bovine serum (FBS, HyClone, Logan, UT, USA), 50 U/mL penicillin, and 50 ┬Ąg/mL streptomycin in a humidified atmosphere of 5% CO2 at 37Ōäā.
Western blot analysis of Rat2 cells
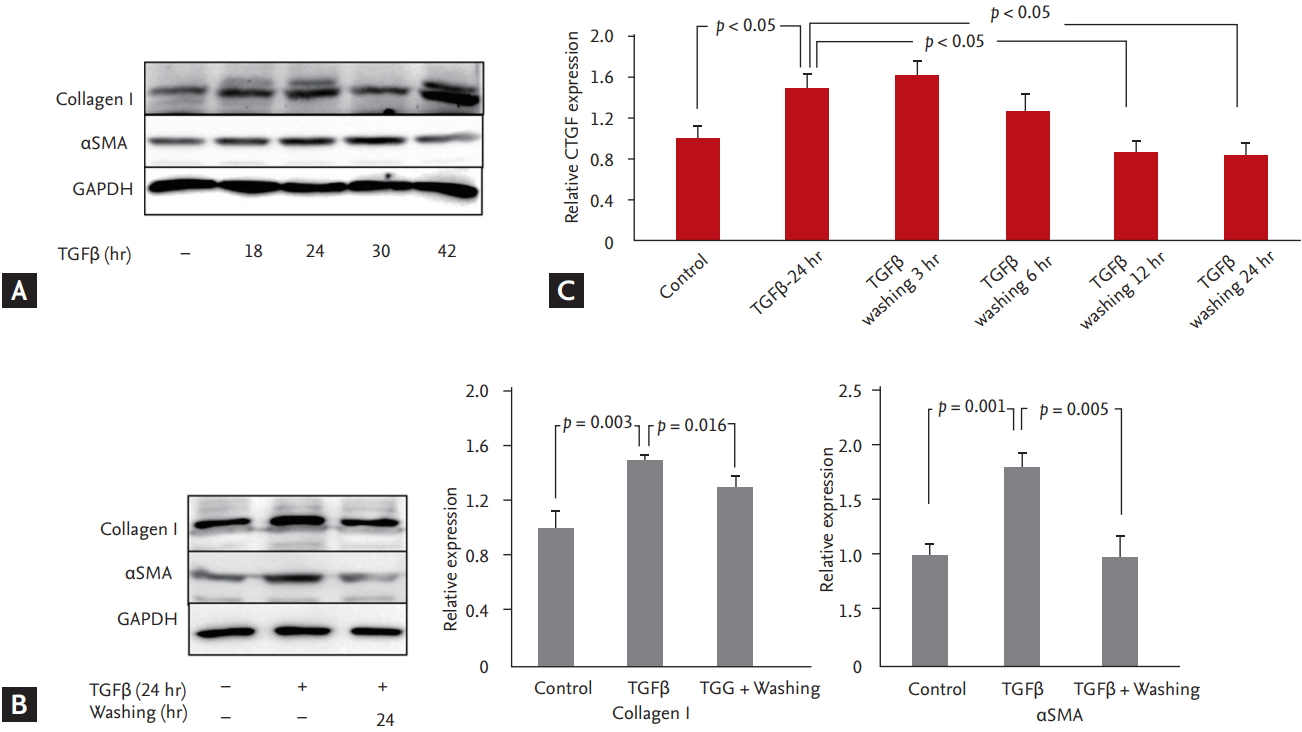
Rat2 cells were plated at a density of 105 cells/mL in complete medium. After 24 hours, the cells were serum-starved with 0.5% FBS for 12 hours and treated with TGF╬▓ (Abcam, Cambridge, MA, USA) for 24 hours before the TGF╬▓ was washed out with complete medium for 24 hours (Fig. 1). The cells were homogenized in lysis buffer and separated by sodium dodecyl sulfate-polyacrylamide gel electrophoresis (SDS-PAGE). Then, the proteins were transferred to nitrocellulose membranes and the signals were detected using antibodies for collagen I, ╬▒-smooth muscle actin (╬▒SMA, Abcam) and glyceraldehyde 3-phosphate dehydrogenase (GAPDH, Cell Signaling Biotechnology, Danvers, MA, USA).
Transfection
Transfection with miRNA-26b mimics was performed in Rat2 cells using Lipofectamine 2000 (Thermo Fisher Scientific, Waltham, MA, USA) for 48 hours. The cells were then treated with TGF╬▓ for 24 hours.
Animal study protocol
Seven-week-old male Sprague-Dawley rats were anesthetized with ketamine (80 mg/kg, intraperitoneally) and xylazine (8 mg/kg, intraperitoneally). Next, orotracheal intubation was performed with a 20-gauge intravenous catheter. Mechanical ventilation was maintained with a Mini-Vent ventilator (Harvard Apparatus, Holliston, MA, USA) containing 2% isoflurane and 98% O2 at a tidal volume of 350 ┬ĄL and a respiratory frequency of 160/min. The banding operation on the ascending aorta was performed with upper hemi-sternotomy and careful separation of the thymus. The ascending aorta was then freely dissected. Banding was performed with a Teflon (DuPont Pharmaceuticals, Wilmington, DE, USA) felt-supported 5ŌĆō0 silk ligation around the ascending aorta with an 18-G blunted needle to prevent aortic rupture. The sternum was fixed, and the muscle layers and skin were closed with three layers of 4ŌĆō0 silk sutures. The sham operation was performed using the same hemi-thoracotomy procedure without ligation. Ketoprofen (5 mg/kg, intramuscular, once daily) and gentamycin (5 mg/kg, intramuscular, once daily) were administered postoperatively over a 3-day period.
Rats in the banding group were euthanized 6 weeks after banding. Rats in the debanding group underwent a debanding operation 28 days after the banding operation and were sacrificed 14 days after the debanding procedure. The debanding procedure was performed via right-sided, muscle-saving thoracotomy in the second intercostal space, with the banded silk on the Teflon felt being cut to avoid aortic rupture. The thymus was repositioned, and the chest was closed in three layers. The animals in the sham group underwent a similar thoracotomy procedure and were sacrificed postoperatively at 6 weeks. Each group included eight rats, and the hearts of all subjects were extracted at 13 weeks.
The study protocol was approved by the Ethics Committee of Daejeon St. MaryŌĆÖs Hospital, College of Medicine, The Catholic University of Korea, Daejeon, and by the Republic of Korea (DMDDJ-AP-2015-09).
Histopathological analyses
After euthanasia, the rat hearts were removed, fixed in 4% formaldehyde, and then embedded in paraffin. Three mid-ventricular sections were stained with hematoxylin-eosin for histological analyses, with periodic acidŌĆōSchiff (PAS) stain for cardiomyocyte size determination, and with MassonŌĆÖs trichrome for fibrosis measurement (Fig. 2). The histopathological evaluation of each slide was performed by a blinded pathologist. The degree of fibrosis was quantified using ImageJ software version 1.44 (U.S. National Institutes of Health, Bethesda, MD, USA) by determining the blue-stained area on the MassonŌĆÖs trichrome-stained slides. Additionally, the cross-sectional areas of at least 10 myocytes were measured from 200-fold-enlarged images of the PAS-stained slides using the same software. Nucleus-centered myocytes in the endocardial layer were assessed.
Echocardiography
Echocardiographic examinations were performed twice on all subjects, at baseline and 6 weeks after banding (except for the debanding group). In the debanding group, additional echocardiographic examinations were performed 4 weeks after banding and 2 weeks after the debanding procedure. Animals were anesthetized with ketamine (80 mg/kg, intraperitoneally) and xylazine (8 mg/kg, intraperitoneally) during the echocardiographic procedures. To achieve a physiologically relevant depth of sedation during echocardiography, the heart rate was maintained at approximately 270 to 320 beats per minute. Conventional echocardiography and tissue Doppler image acquisition were performed using a 13 MHz linear array transducer (GE i13 L, Vivid E9, General Electric, Waukesha, WI, USA). Images were acquired at 35 to 45 frames/beat (110 to 190 frames/sec) using the shallowest possible depth and the smallest possible sector size [12]. Effective banding procedures were confirmed by an echocardiographic finding of maximal peak velocity at the ligation site (i.e., greater than 3 m/sec). Relieved constriction of the ascending aorta after the debanding procedure was also documented through Doppler findings. Echocardiographic imaging findings, including M-mode images and global longitudinal strain (GLS) measurements from the parasternal long-axis view, were used to measure cardiac remodeling and systolic and diastolic left ventricular function (Supplementary Material) [13-16]. A single investigator who was blinded to the animal groups performed all image acquisitions and offline measurements.
ELISA
LV myocardium samples were stored in RNAlater solution (Ambion, Austin, TX, USA). Frozen tissues were homogenized, followed by centrifugation for 10 minutes at 12,000 rpm at 4Ōäā. CTGF, TGF╬▓1, and MMP2 levels in LV myocardial tissues were quantified via ELISA according to the manufacturerŌĆÖs instructions: CTGF (Aviva Systems Biology, San Diego, CA, USA), MMP2 (Abnova, Taipei, Taiwan), and TGF╬▓1 (Abnova). The optical density of the samples was determined at 450 nm in an automated microplate reader (Bio-Rad Laboratories, Hercules, CA, USA).
Real-time quantitative polymerase chain reaction
To analyze the expression of CTGF in Rat2 cells, total RNA was isolated using the easy-BLUE Total RNA Extraction Kit (iNtRON, Seongnam, Korea). The cDNA was synthesized using the Reverse Transcriptase Premix (Elpis Biotech., Daejeon, Korea) and was amplified in a Power SYBR┬« Green PCR Master Mix (Applied Biosystems, Warrington, UK) with CTGF-specific primer pairs (F: 5ŌĆÖ-AAGACACATTTGGCCCTGAC-3ŌĆÖ, R: 5ŌĆÖ-GAGTGTCTGGGGGCAGAGTA-3ŌĆÖ) and GAPDH-specific primer pairs (F: 5ŌĆÖ-CCCCTTCATTGACCTCAACTACA-3ŌĆÖ, R: 5ŌĆÖ-TCCCATTCTCAGCCTTGACTGT-3ŌĆÖ) as the endogenous control. miRNAs were extracted from the myocardial tissues and Rat2 cells using the miRCURY RNA Isolation Kit (Exiqon, Woburn, MA, USA). Reverse transcription was performed with the miScript II RT Kit (QIAGEN, Hilden, Germany). A miRNA-specific miScript Primer Assay was purchased from QIAGEN, and real-time polymerase chain reaction was performed on a 7500 Fast Real-Time PCR System (Applied Biosystems, Foster City, CA, USA). The fold change for each miRNA was calculated using the comparative Ct (2ŌłÆ╬ö╬öCt) method, and RNU48 (a small nuclear RNA) served as an endogenous control. All reactions were performed in triplicate for each sample.
Statistical analysis
Statistical analysis was performed using commercially available software SPSS version 20 (IBM Co., Armonk, NY, USA). Differences between groups were assessed using 2-tailed StudentŌĆÖs t tests. Differences among three groups were assessed using one-way analysis of variance with post hoc Tukey tests. The data are presented as the mean value ┬▒ standard deviation. A p < 0.05 was considered to indicate statistical significance.
RESULTS
Screening for miRNAs regulating CTGF
Online miRNA databases such as www.targetscan.org were used to predict several miRNAs that regulate the expression of CTGF. Using the miRNA databases, we found several conserved miRNAs and compared their expression to that of CTGF; ultimately, we chose miRNA-26b, miRNA-133a, and miRNA-19b with a probability of preferentially conserved targeting greater than 0.69 [17].
Assessment of left ventricular structural changes in rats following ascending aortic banding and debanding by echocardiography
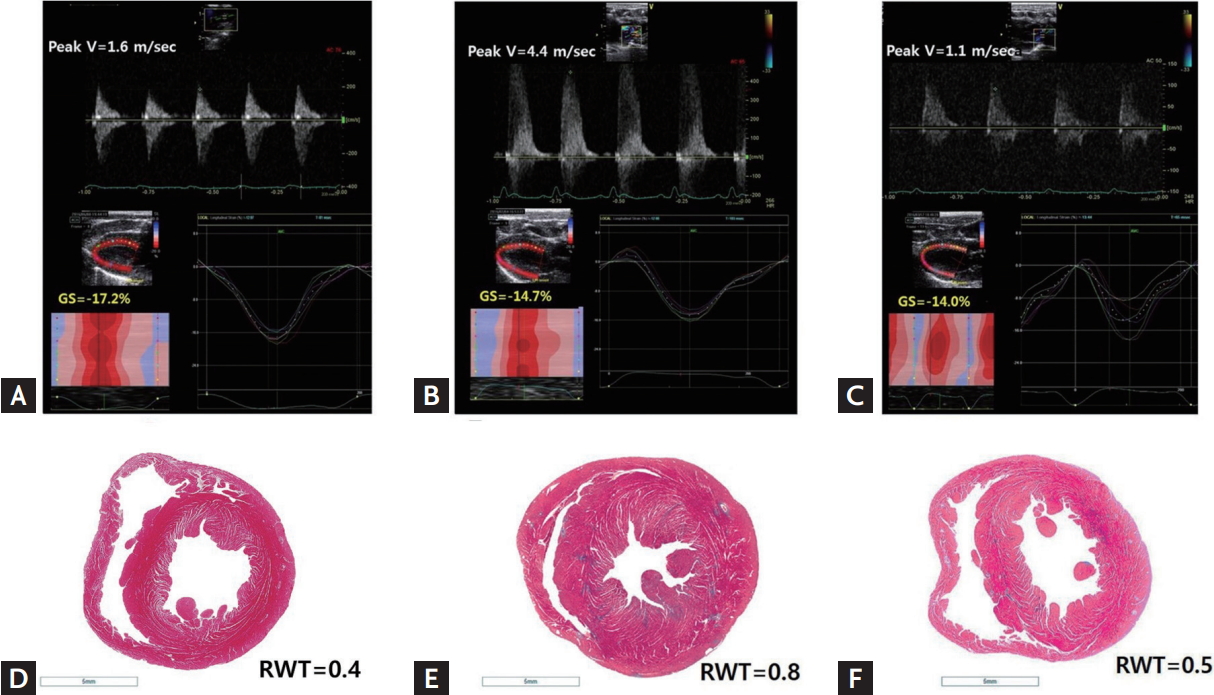
Based on echocardiography, concentric LVH resulted from the ascending aortic banding operation and was relieved after the debanding operation (relative wall thickness [RWT]: 0.41 ┬▒ 0.01 vs. 0.81 ┬▒ 0.13 vs. 0.64 ┬▒ 0.09 in the sham vs. banding vs. debanding group, respectively, p < 0.001) (Table 1, Fig. 2). Heart weight/tibia length did not differ significantly between the debanding and sham groups, indicating that the debanding operation resulted in LVH regression. Compared with the LV mass of the banding group, the LV mass, which was calculated using the cubed formula based on echocardiography, of the debanding group was not significantly decreased, as the LV chamber tended to be larger because of relieved concentric LVH after the debanding procedure (Table 1).
Reactive myocardial fibrosis was significantly increased in the banding group but was not significantly relieved by the debanding operation until 2 weeks after the operation (Table 2). Compared with the other groups, the banding group exhibited hyperdynamic LV systolic function. Additionally, E/EŌĆÖ was significantly increased in the banding group (Table 1).
The three-layered global circumferential strain and radial strain did not differ significantly among the groups. However, compared with the GLS in the sham group, the GLS in the banding and debanding groups was significantly increased (Table 2). In addition, compared with that in the banding group, the GLS in the debanding group was not significantly improved (GLS: ŌĆō18.7 ┬▒ 1.0 vs. ŌĆō15.2 ┬▒ 2.3 vs. ŌĆō15.5 ┬▒ 2.7 for the sham vs. banding vs. debanding group, p = 0.008), possibly because myocardial fibrosis was not significantly improved in the debanding group (Fig. 3).
CTGF and CTGF-targeting miRNAs in the banding and debanding models
To confirm the results from the in vivo test, CTGF, miRNA-26b, miRNA-133a, and miRNA-19b were assessed in both the banding model (a pressure remodeling model) and the debanding model (a reverse remodeling model).
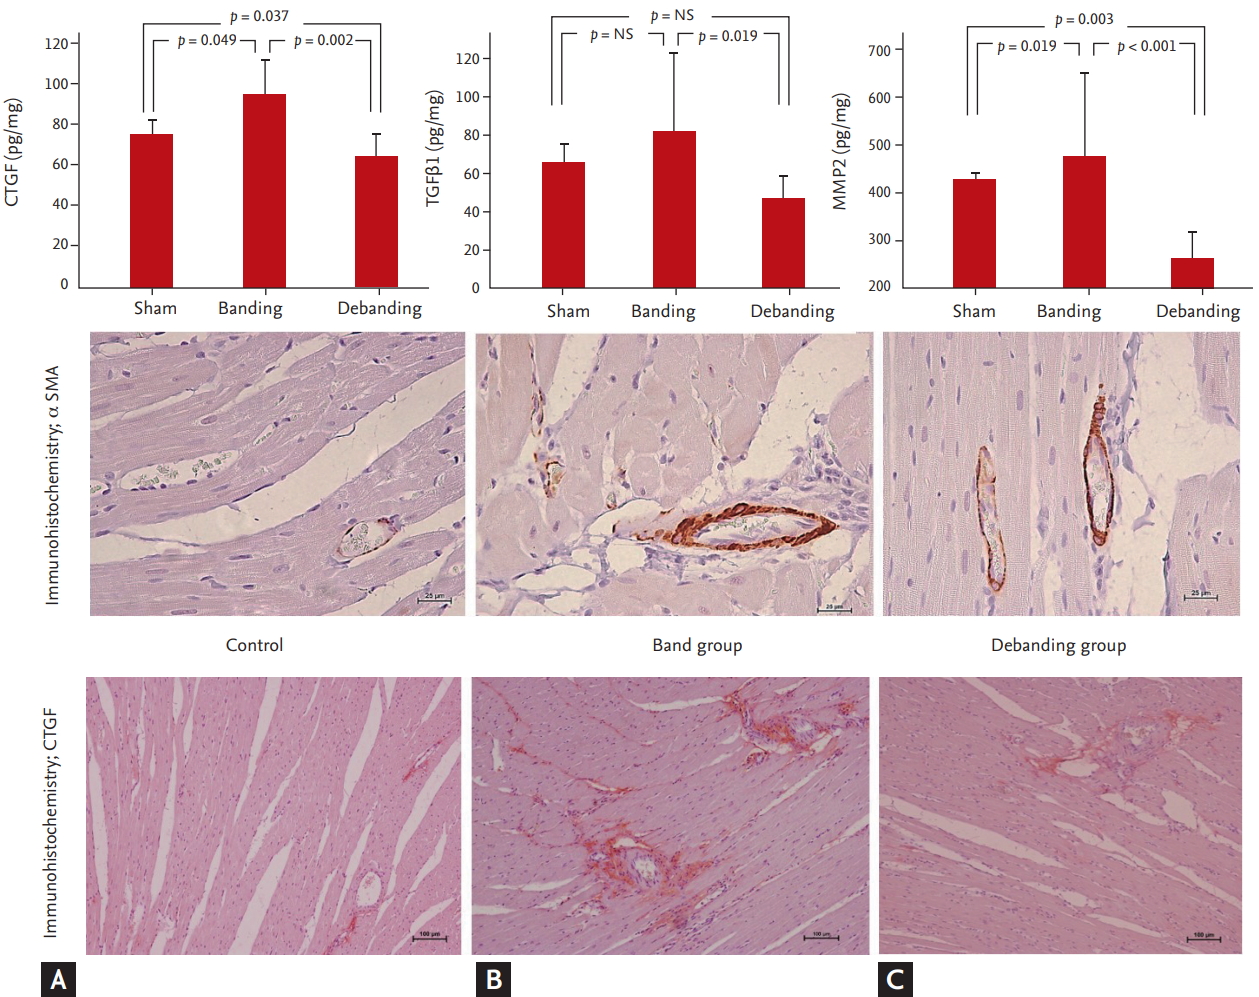
CTGF levels were significantly higher in the banding group than in the sham and debanding groups (75.8 ┬▒ 7.6 pg/mg vs. 98.2 ┬▒ 19.4 pg/mg vs. 64.5 ┬▒ 14.1 pg/mg in the sham vs. banding vs. debanding group, respectively, p = 0.002). MMP2 and TGF╬▓1 levels tended to increase in the banding group and were significantly decreased in the debanding group (MMP2: 426.0 ┬▒ 11.8 pg/mg vs. 573.3 ┬▒ 122.2 pg/mg vs. 259.6 ┬▒ 67.1 pg/mg in the sham vs. banding vs. debanding group, respectively, p < 0.001; TGF╬▓1: 64.7 ┬▒ 9.5 pg/mg vs. 89.8 ┬▒ 42.2 pg/mg vs. 47.0 ┬▒ 13.2 pg/mL, respectively, p = 0.002) (Fig. 3).
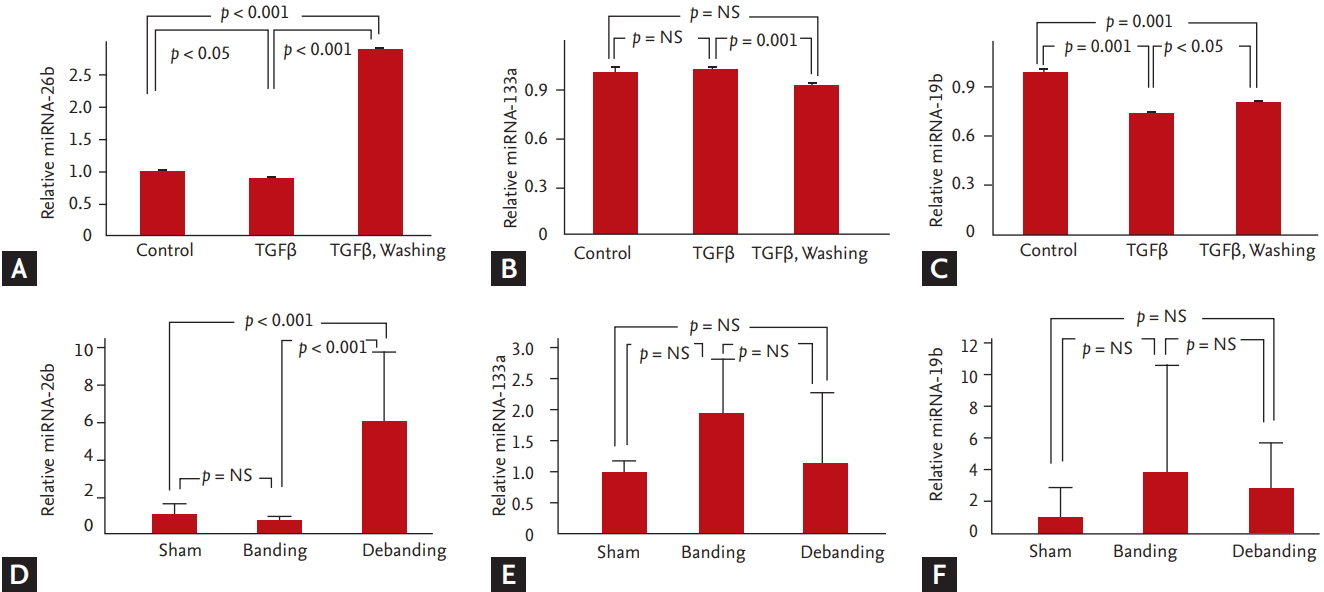
We analyzed the levels of miRNA-26b, miRNA-133a, and miRNA-19b using RT-PCR. The relative expression level of miRNA-26b was higher in the debanding group than that in the banding group (miRNA-26b: 1.0 ┬▒ 0.6 vs. 0.6 ┬▒ 0.2 vs. 6.0 ┬▒ 3.01 in the sham vs. banding vs. debanding group, respectively, p < 0.001) (Fig. 4).
CTGF was increased in TGF╬▓-stimulated fibroblasts and decreased in TGF╬▓-washed fibroblasts
We observed elevation of CTGF after 24 hours of treatment with TGF╬▓ in Rat2 fibroblasts. CTGF levels were observed after 3, 6, 12 and 24 hours of TGF╬▓ washing. After 24 hours of TGF╬▓ washing, CTGF was significantly decreased.
Markers of fibrosis, specifically collagen I, ╬▒SMA and GAPDH, were significantly increased after 18 hours of treatment with TGF╬▓ and decreased after 24 hours of TGF╬▓ washing (Fig. 1).
miRNA-26b downregulated CTGF in the reverse remodeling model
Based on the results, we divided the cells into three groups: the control group, the remodeling group with elevated CTGF levels following 24 hours of TGF╬▓ treatment, and the reverse remodeling group with decreased CTGF levels following 24 hours of TGF╬▓ washing. miRNA-26b was significantly increased in the TGF╬▓-washed group compared with the control and TGF╬▓-stimulated groups. However, miRNA-19b was significantly decreased in the TGF╬▓-stimulated group and TGF╬▓-washed group compared with the control group (Fig. 1).
Transfection of fibroblasts with miRNA-26b mimic decreased the relative expression of CTGF. Stimulation of fibroblasts with TGF╬▓1 increased the relative expression of CTGF and decreased that of miRNA-26b. TGF╬▓1 washing decreased CTGF expression and increased miRNA-26b expression (Fig. 5).
DISCUSSION
This study examined the relationship between CTGF-targeting miRNAs and pressure overload-mediated cardiac fibrosis. Studies using models of aortic banding and debanding demonstrated that miRNA-26b was significantly increased after aortic debanding. The in vitro model yielded the same result: miRNA-26b was upregulated after removal of TGF╬▓ from the fibroblasts. Furthermore, fibroblasts transfected with miRNA-26b mimic had decreased relative expression of CTGF. These results suggest that miRNA-26b plays a role in CTGF suppression in the reverse cardiac remodeling model.
Concentric remodeling in the ascending aorta banding model was reversed by the debanding operation. Although the debanding model did not show statistically significant regression of myocardial fibrosis, the level of CTGF in myocardial tissue was significantly increased in the ascending aortic banding model and decreased in the subsequent debanding model. CTGF is a central mediator of tissue remodeling and fibrosis upon interaction with a variety of molecules, including cytokines and growth factors such as TGF╬▓, VEGF, and IGF1, as well as matrix proteins [8-10]. CTGF is required for the TGF╬▓-induced proliferation of myofibroblasts. Several studies have indicated that TGF╬▓-induced collagen production is attenuated by a CTGF antibody or an antigen oligonucleotide targeting CTGF [11,18]. Therefore, it is important to identify miRNAs that repress CTGF gene expression [19-22].
In the present study, compared with that in the sham group, the CTGF level in myocardial tissue in the banding model group was significantly increased; in contrast, the debanding model group had significantly decreased levels of CTGF in myocardial tissue than the banding model group (Fig. 3). We created an in vitro model with the same conditions as the in vivo model and evaluated CTGF over time upon TGF stimulation, as shown in Fig. 1. After 24 hours of TGF stimulation, CTGF was significantly increased; collagen I and ╬▒SMA, markers of fibrosis, were also increased. Because the fibroblasts exhibited decreased CTGF, collagen I, and ╬▒SMA after 24 hours of TGF╬▓ washing, we speculate that the TGF╬▓ stimulation model and the TGF╬▓ washing model are suitable in vitro models of banding and debanding, respectively.
The relative expression of miRNA-26b was significantly upregulated in the debanding group and not in the banding group. In previous studies, functional annotation analyses of predicted target genes of miRNA-26b have revealed enrichment for genes in FGF, TGF╬▓, p53, and apoptosis signaling pathways, which are related to cell growth and survival functions [23]. In particular, miRNA-26b is encoded by the introns of its host gene, carboxy-terminal domain RNA polymerase II polypeptide A small phosphatase 2 (CTDSP2), and reduces the mRNA levels of this host gene [24]. CTDSPs act as phosphatases and dephosphorylate the linker regions of regulatory SMADs, activating TGF╬▓/SMAD signaling [25,26]. Furthermore, in vivo, we showed that miRNA-26b was upregulated in the TGF╬▓-washed group, which had lower levels of CTGF than the TGF╬▓-stimulated group. In addition, transfection of fibroblasts with miRNA-26b mimic suppressed CTGF (Fig. 5).
Previous studies have shown that miRNA-19b is inversely correlated with collagen fibril cross-linking protein and with the enzyme lysyl oxidase (LOX), which regulates collagen fibril cross-linking protein. miRNA-19b has also previously been shown to decrease in fibroblasts after TGF╬▓ stimulation in vitro [27]. Notably, patients with heart failure due to AS have lower levels of miRNA-19b than patients without heart failure due to AS. Furthermore, miRNA-19b is known to be associated with aortic aneurysm [27]. However, our in vivo studies did not yield the same results as the in vitro studies, and the standard deviation of the banding group was high. This discrepancy might be attributable to differences between the previous model and our banding model, which had a relatively short pressure overload duration and was not combined with heart failure due to pressure overload. In addition, the fibrosis in our model was not severe, and our model involved two aortic surgeries, which could have affected miRNA-19b levels.
In the present study, the banding operation provoked concentric LVH: compared with the RWT in the sham group, the RWT in the banding group was increased. The debanding operation reversed the concentric remodeling RWT observed in the debanding group: compared with the RWT in the banding group, the RWT in the debanding group was reduced but was still greater than that in the sham group (Table 1 and Fig. 2). In previous studies using the banding model, reactive interstitial fibrosis has been shown to worsen progressively from the endocardium to the epicardium over 6 to 12 months, depending on the banding duration [14]. GLS, a parameter of deformation, was significantly increased in the banding model. However, GLS did not show improvement in the debanding model (Table 2), possibly because myocardial fibrosis was not significantly relieved after the debanding operation, even though it relieved concentric remodeling.
There are several limitations of this study. The acute severe LV pressure overload model in the ascending aorta and the subsequent debanding procedure result in a high mortality rate (greater than 15%) because of aortic rupture during the dissection of periaortic adhesions [3,4]. In the present study, Teflon felt-supported banding of the ascending aorta reduced mortality to less than 5% by preventing aortal injury during the cutting of the banded silk. Site velocity (for banding and debanding) was not estimated through invasive carotid catheterization; instead, echocardiography was used to determine whether the banding and debanding models were appropriate. In our study, fibrosis was not significantly reversible after debanding because no medication was administered [4]. Furthermore, echocardiography was performed in rats sedated with ketamine injections, which could decrease heart performance. Additionally, all groups were treated using identical methods. The frame rate relative to the heart cycle duration was lower than that in previous animal studies, where higher frame rates occurred due to the use of different instrumentation and algorithms [16].
In conclusion, the ascending aortic banding and subsequent debanding models can very feasibly be used to obtain evidence for studies on cardiac hypertrophy or recovery that involve molecular and cellular biology, pathology, and echocardiographic imaging techniques. Additionally, miRNA-26b may play an important role in CTGF suppression in the reversal of cardiac remodeling from pressure overload. Therefore, miRNA-26b may be a therapeutic target for pressure overload-induced cardiac hypertrophy and fibrosis.
KEY MESSAGE
1. Banding and debanding of the ascending aorta in a rat model are feasible methods for simulation of severe pressure overload with cardiac remodeling and recovery.
2. MicroRNA-26b may play an important role in connective tissue growth factor suppression in the reverse remodeling of pressure overload-mediated myocardial fibrosis.

 PDF Links
 PubReader
 ePub Link
 Full text via DOI
 Download Citation
 Supplement 1
 Print
Print


