


INTRODUCTION
Pulmonary tuberculosis (TB) is a chronic disease caused by the bacillus Mycobacterium tuberculosis and spreads from person to person through airborne transmission. TB remains a leading cause of morbidity and mortality in many countries. Current anti-TB treatments have several problems, including the development of multidrug resistance and human immunodeficiency virus (HIV) coinfection [1,2]. TB usually affects the lungs but can also affect other parts of the body, such as the brain, intestines, kidneys, and/or the spine [3]. In cases of pulmonary TB, symptoms include chronic cough, chest pain, hemoptysis, weakness or fatigue, weight loss, fever, and night sweats [4]. Determination of TB activity is as important as early diagnosis for optimal treatment. Chest radiography, sputum acid-fast staining, and mycobacterial culture are the common clinical methods used to evaluate the therapeutic response of pulmonary TB [5]. Novel diagnostic tools, including serological tests and interferon-╬│ release assays, have been developed for the rapid and accurate diagnosis of latent TB [6,7]. However, it is still uncertain whether these test results reflect disease activity and/or therapeutic response [8].
Neuron-specific enolase (NSE; phosphopyruvate hydratase) is the neuronal form of the glycolytic enzyme enolase, which is found in brain tissue extracts, neuroendocrine cells, and neuroendocrine tumors including small cell lung cancer (SCLC) [9,10]. Inoue et al. [11] have reported significantly higher NSE level in cerebrospinal fluid during bacterial meningitis. In addition, non-malignant inflammatory lung disorders have been reported to be associated with abnormal NSE serum concentration [12,13]. In a study from Collazos et al. [12], 27.3% of all patients with active pulmonary TB had increased NSE concentration compared with 11.1% of all patients with overall benign pulmonary disease. Recently, Stammet et al. [14] have reported that serial NSE values are strong predictors of poor outcome after out-of-hospital cardiac arrest.
To date, there have been no reports on the relationship between activity of pulmonary TB and serum NSE concentration or on NSE concentration changes depending on treatment and extent of lung infiltration. It is uncertain whether NSE is an acute phase reactant, such as high-sensitivity C-reactive protein (hs-CRP), an acute-phase protein and nonspecific marker of bacterial pneumonia, or if NSE is a potential biomarker of active and latent TB [15]. Honda et al. [16] have reported that NSE is released from macrophages stimulated with interferon-╬│ in hemophagocytic lymphohistiocytosis (HLH) and have suggested that serum NSE level is a useful marker for predicting the disease progression of HLH. Based on the pathogenetic similarity between HLH and TB, we postulated that macrophages stimulated by interferon-╬│ within the granuloma tissue also produce NSE in TB, and the resulting elevated serum NSE concentration can serve as a useful biomarker of disease activity of TB. Macrophages have been shown to play a key role in the formation of granulomas in TB infection [17-19]. Kang et al. [17] have reported that macrophages produce VEGF, HIF-1╬▒, and thymosin ╬▓4, suggesting that these species promote the development of granuloma.
In this study, we aimed to measure serum NSE and hs-CRP concentrations to establish the clinical correlations between NSE and hs-CRP serum concentrations with extent of inflammation in patients with active TB and to establish the origin of NSE in granulomatous lesions in patients with tuberculoma.
METHODS
Patients and study design
Sixty patients diagnosed with active pulmonary TB who completed treatment using first-line anti-TB agents at Kosin University Gospel Hospital from January to December 2010 and 30 age- and sex-matched healthy controls were enrolled in this retrospective study. The diagnosis of active pulmonary TB was based on a positive respiratory specimen culture and/or a positive result in a TB-polymerase chain reaction assay. Treatment regimens for TB have an initial phase of 2 months, followed by a continuation phase of either 4 or 7 months (total of 6 or 9). For initial treatment of TB, patients were treated with a 4-drug regimen including isoniazid, rifampin, ethambutol, and pyrazinamide. After 2 months, pyrazinamide was discontinued.
Sputum smear for acid-fast bacilli (AFB), mycobacterial culture for M. tuberculosis, and chest radiography were examined every 1 or 2 months during treatment. For patients who did not expectorate sputum, bronchoscopy was conducted for mycobacterial culture of M. tuberculosis. Patients with malignancy or recurrent TB infection were excluded based on medical history evaluation.
The objective of this study was to compare the serum NSE concentrations of TB patients with those of age-and sex-matched healthy controls. The study further aimed to determine whether NSE concentration changes after anti-TB treatment and whether NSE concentration could be used to monitor TB activity and treatment response. Patients underwent blood sampling to determine serum NSE concentration before and after completion of anti-TB treatment. The group of patients with TB was composed of 25 men and 35 women with a mean age of 64.2 years (range, 18 to 78). All patients underwent clinical, laboratory, and radiologic evaluations and were categorized into either a focal segmental infiltration group (35 patients total, including 10 tuberculoma, 15 segmental infiltration, and 10 small nodular infiltration patients) or an extensive infiltration group (25 patients, including five miliary and 20 lobar infiltration patients) (Table 1). Both serum and biopsy samples were obtained from the Department of Pathology at Kosin University College of Medicine. This study was approved by the Institutional Review Board and Ethics Committee of Kosin University Gospel Hospital (KUGH IRB No. 13-085) and was conducted in accordance with the Declaration of Helsinki.
Measurement of serum NSE and hs-CRP
Serum concentrations of NSE and hs-CRP were determined by radioimmunoassay. Normal serum NSE and hs-CRP concentrations were set at less than 15 ng/mL and 3 mg/L, respectively. Hemolytic specimens were excluded because blood cell lysis influences the measured concentrations of both biomarkers.
Immunohistochemical staining of granulomatous lesions
Immunohistochemical staining of lung biopsy specimens of 10 TB-infected patients was performed using antibodies against NSE and a human macrophage marker, CD68. Specimens were obtained from the Department of Pathology at Kosin University College of Medicine. Immunohistochemistry was performed on 4-╬╝m-thick sections of paraffin blocks using the Bond-Max Autostainer (Leica Microsystems, Bannockburn, IL, USA). Tissue sections were deparaffinized and rehydrated following standard procedures. Heat-induced antigen retrieval was carried out, and sections were incubated with primary antibodies for 32 minutes at 37oC at a dilution of 1:3 polyclonal rabbit anti-NSE and 1:6,000 anti-CD68 antibodies (Dako, Carpinteria, CA, USA). Primary antibody binding was detected using the Bond Polymer Refine Detection kit (Leica Microsystems) according to the manufacturerŌĆÖs instructions.
Immunofluorescence analysis
Tissue microarrays consisting of 100 tissue cores (80 TB-infected, eight lung cancer, and 12 normal) were purchased from US Biomax (Rockville, MD, USA). No clinical information except age, sex, and pathological status of each patient was available for the tissues in these arrays. Patient characteristics and NSE and CD68 staining intensities in the tissue microarray are described in Supplementary Table 1. For immunofluorescence analysis, tissue slides were deparaffinized and hydrated. For antigen retrieval, slides were immersed in citrate buffer (0.01 M, pH 6.0) and heated twice in a microwave (700 W or higher) for 5 minutes each. Slides were permeabilized by incubation in phosphate-buffered saline (PBS) containing 0.1% Triton X-100 for 5 minutes and then incubated with 10% normal serum in PBS for 1 hour to block nonspecific antibody binding. Slides were then incubated with a mixture of antibody to NSE (1:200 dilution; Dako) and CD68 (1:100 dilution; Dako) overnight at 4┬░C. After primary antibody incubation, slides were washed three times in PBS each for 5 minutes and incubated with secondary antibodies (Alexa Fluor 546-conjugated anti-mouse antibody and Alexa Fluor 488-conjugated anti-rabbit antibody, Invitrogen, Carlsbad, CA, USA) for 1 hour. Specimen epifluorescence was examined using confocal laser-scanning microscopy. The specificity of each antibody was confirmed by staining with rabbit or mouse polyclonal immunoglobulin G. A well-trained pathologist read the slides and scored the signals of NSE and CD68 blinded to clinical information.
Statistical analysis
Statistical analyses were conducted using SPSS version 20.0 (IBM Co., Armonk, NY, USA). Patient characteristics were summarized descriptively. A two-tailed p value less than 0.05 was considered statistically significant. Correlation analyses were performed to generate the Pearson correlation coefficients to determine the relationships between variables. Paired t tests were conducted to compare the differences in NSE and hs-CRP concentrations before and after anti-TB treatment.
RESULTS
NSE and hs-CRP concentrations in patients with tuberculosis
NSE serum concentration was significantly higher in pulmonary TB patients (mean [range], 24.59 ng/mL [15.20 to 40.00]) than in matched healthy controls (5.05 ng/mL [2.00 to 8.00]; p < 0.05). In addition, hs-CRP was also significantly higher in pulmonary TB patients (4.24 mg/L [0.61 to 8.64]) than in controls (0.80 mg/L [0.10 to 4.30]; p < 0.001) (Table 1). The mean serum concentrations of NSE and hs-CRP in the extensive type group (25.12 ng/mL and 4.12 mg/L, respectively) were significantly higher than those in the focal segmental type group (20.23 ng/mL and 2.12 mg/L, respectively; p = 0.04).
Correlation between NSE and hs-CRP before and after treatment
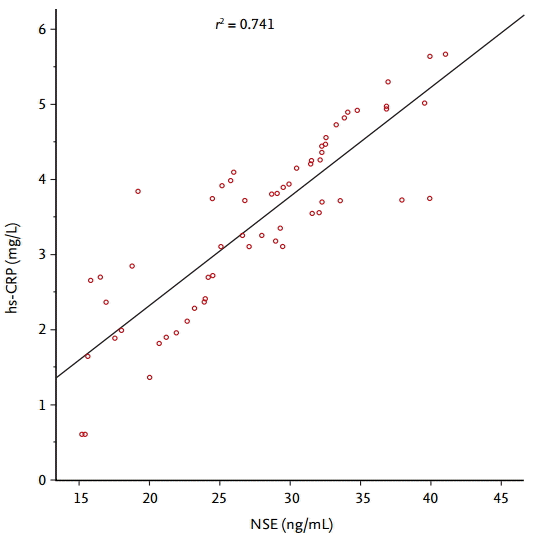
Serum NSE concentration positively correlated with hsCRP concentration in active pulmonary TB patients (p = 0.002, r2 = 0.741) (Fig. 1). After anti-TB therapy (i.e., at 6 or 9 months after the start of anti-TB treatment), the concentrations of both biomarkers were considerably lower than before anti-TB therapy; NSE decreased from 24.59 (15.20 to 40.00) to 7.23 (2.2 to 11.4) ng/mL and hs-CRP from 4.24 (0.61 to 8.64) to 1.62 (0.40 to 3.82) mg/L (Fig. 2).
Detection of NSE and CD68 by immunohistochemical staining
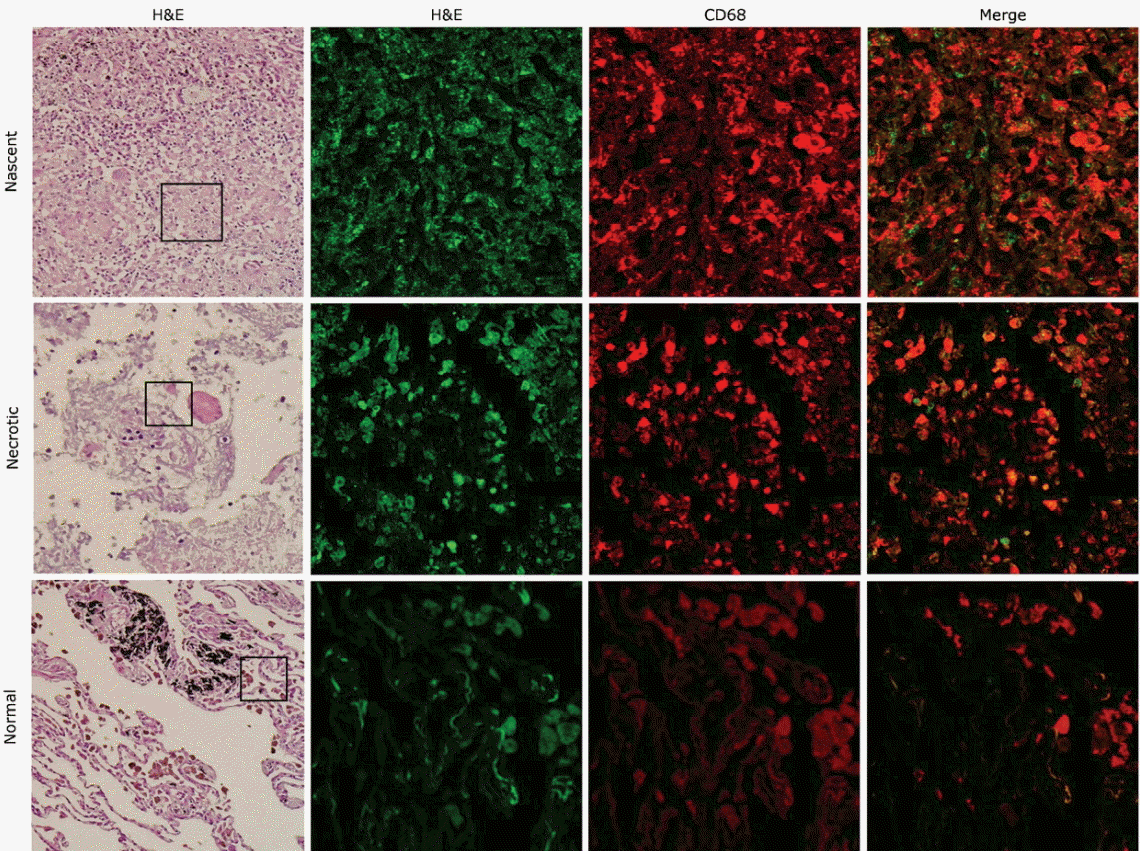
Immunohistochemical staining revealed a large number of both NSE- (green arrows) and CD68-positive (red arrows) macrophages around caseating necrosis in granulomatous lesions, indicating that NSE is produced by CD68-positive macrophages within granulomatous lesions (Fig. 3).
Signals of NSE and CD68 in immunofluorescence analysis
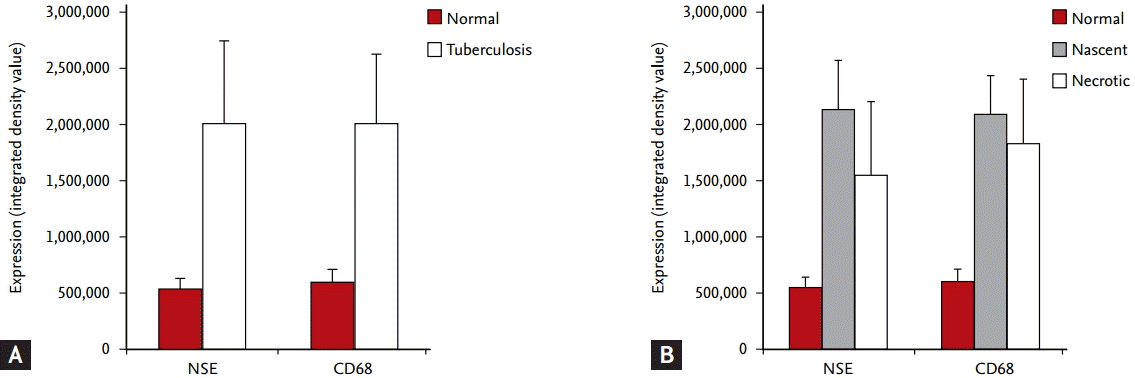
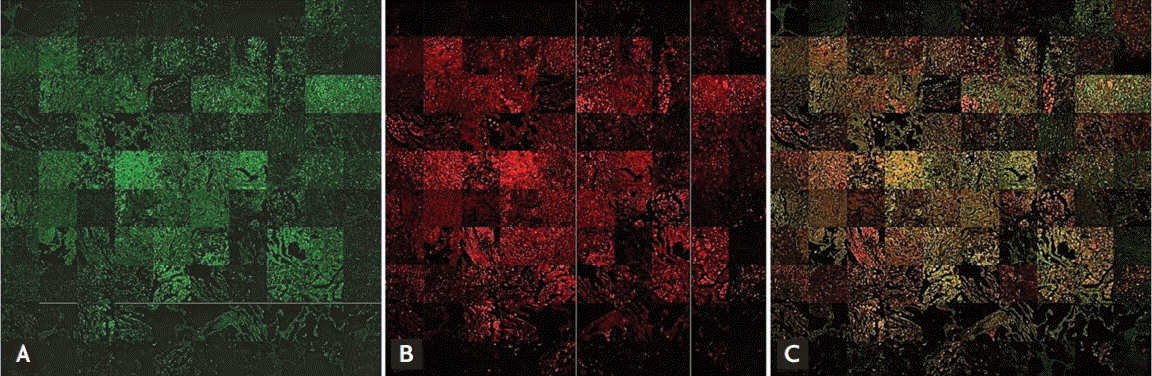
NSE and CD68 were examined in patient tissue microarrays containing normal lung, lung cancer, TB-infected, and necrotic TB-infected tissues. Staining of both NSE and CD68 was notably higher in TB tissues with nascent and necrotic lesions than in normal tissue (Fig. 4). Immunofluorescence analysis showed that both NSE and CD68 staining were strong at the cores of granulomas in both nascent and necrotic granulomatous lung tissues. Double staining of NSE and CD68 showed that NSE co-localized with CD68 in nascent and necrotic granulomas (Figs. 5 and 6). Information on the integrated density values of CD68 and NSE staining from immunofluorescence analysis of the tissue microarray are described in Supplementary Table 2.
DISCUSSION
Chest radiography, sputum acid-fast staining, and mycobacterial cultures are usually used for evaluating the therapeutic response of pulmonary TB [20]. However, these tests all have limitations. Chest radiography improves slowly with treatment and does not accurately reflect the activity of pulmonary TB. Acid-fast smear has poor sensitivity, requiring a large number of bacilli to be present in specimens [21]. Mycobacterial culture after treatment requires clinicians to wait up to several weeks, which delays response to treatment failure [22]. Thus, there is great need to discover novel clinical parameters that can quickly and accurately assess disease activity and/or treatment response.
Serum NSE concentration is a known useful biomarker of SCLC, retinoblastoma, and neuroblastoma [9,10]. Despite its clinical utility as a biomarker of malignant disease, NSE concentration has not been used to measure disease activity in TB patients. In our study, all TB patients showed elevated serum NSE concentration. More importantly, serum NSE and hs-CRP concentrations correlated with the extent of inflammation determined by chest X-ray (CXR). Patients with extensive-type infiltration had higher NSE and hs-CRP levels than those with focal segmental infiltration. In line with our observations, Collazos et al. [12] also reported that patients with alveolar infiltrates or interstitial patterns on CXR have higher NSE concentration than those with normal radiographs.
A hs-CRP, which is produced by the liver, is an acute phase protein that is often used as a nonspecific marker of benign inflammatory diseases and promotion of phagocytosis [23-25]. Thus, we also investigated the correlation between NSE and hs-CRP concentrations in pulmonary TB patient groups. We found a strong positive correlation between these parameters and observed that both NSE and hs-CRP concentrations decreased significantly after TB treatment (Fig. 2). Therefore, our results suggest that NSE in combination with hs-CRP may be a useful clinical parameter to test for pulmonary TB. Further investigation designed to determine the trends of NSE and hs-CRP during and at the end of TB treatment will be needed in order to develop NSE/hs-CRP as biomarkers for treatment response monitoring. Almost all patient symptoms, radiological findings, and sputum AFB stains improved over the course of treatment in this study; however, we were unable to perform statistical analysis due to the small sample size.
While the incidence rate of TB continues to decline in most industrialized nations, patients with latent or multidrug-resistant TB infection still constitute a vast pool of individuals who might develop TB, particularly when they become immunocompromised. The diagnosis and treatment of latent TB infection are therefore increasingly important goals for TB control [26,27]. Further research should be performed to confirm the relationship between NSE concentration and disease activity in latent TB patients.
To our knowledge, there has been no concerted effort to understand the role of NSE in TB. In a study by Collazos et al. [12], the origin of NSE production was suggested to be destruction of neural and neuroendocrine cells. However, the exact origin of NSE has not been established in TB infection. In this study, we hypothesized that the origin of NSE is macrophages, which play a key role in the formation of granulomatous lesions in patients with active tuberculoma. Immunohistochemical staining revealed a large number of both NSE- and CD68-positive macrophages around caseating necrosis in granulomatous lesions. Immunofluorescence analysis showed that both NSE and CD68 signals were markedly higher and co-localized in the cores of granulomas in both nascent and necrotic granulomatous lung tissues compared to normal lung tissues. Based on these results, the elevated concentration of serum NSE in patients with granulomatous lesions might have originated from macrophages. Our study suggests the potential role of macrophages in elevated NSE concentrations in other benign lung diseases. The results obtained from this research should be further strengthened by the investigation of NSE and hs-CRP concentrations in other inflammatory lung diseases, such as bacterial pneumonia.
In conclusion, Serum NSE and hs-CRP concentrations were elevated corresponding to the extent of lung inflammation in active pulmonary TB patients. With anti-TB treatment, NSE and hs-CRP concentrations decreased significantly with serial improvement in follow-up chest radiographs. Serum NSE and hs-CRP concentrations were related to the activity and severity of pulmonary TB. Further investigation is needed to identify NSE and hs-CRP as clinical parameters to monitor TB activity and treatment responses. Our results also suggest that elevated serum NSE concentration at least partially originates from macrophages in granulomatous lesions.
KEY MESSAGE
1. Serum neuron-specific enolase (NSE) and high-sensitivity C-reactive protein (hs-CRP) concentrations were related to the activity and severity of pulmonary tuberculosis (TB).
2. With anti-TB treatment, NSE and hs-CRP concentrations decreased significantly with serial improvement in follow-up chest radiographs.
3. Elevated serum NSE, at least, partially originates from macrophages in granulomatous lesions.


 PDF Links
 PubReader
 ePub Link
 Full text via DOI
 Download Citation
 Supplement 1
 Print
Print


