


INTRODUCTION
Thyroid stimulating hormone (TSH) which is secreted by the pituitary gland, has an inverse logarithmic relationship with free thyroxine (fT4) [1]. Because small changes in serum fT4 concentration can lead to more dramatic changes in serum TSH, measurement of the latter is one of the most sensitive methods of screening for thyroid dysfunction [2]. The laboratory reference range is usually defined by using the 95% confidence limits of a population of subjects without known thyroid dysfunction. Some reports define the lower limit of TSH as 0.2-0.4 mU/L and the upper limit as 2.4-4.2 mU/L [1,2]. The third National Health and Nutrition Examination Survey NHANES III (1988-1994) found that the laboratory reference range, defined from values in the normal population, was 0.4-4.12 mU/L. Results also showed ethnic difference in TSH concentration among White, Black, and Mexican American respondents. Therefore, questions are increasingly being raised over whether the normal range of TSH concentrations in Asians is similar to that in Caucasians.
With the increasing awareness of subclinical forms of hyperthyroidism and hypothyroidism and increasing concern about thyroid disease in Korea, routine health examinations that include thyroid function are increasingly popular. There are few controversies regarding diagnosis and management of subclinical hyperthyroidism, as the adverse effects of subclinical hyperthyroidism such as osteoporosis, cardiovascular disease, and arrhythmia are well-known [3]. In contrast, the definition of subclinical hypothyroidism with reference to the normal TSH concentration range remains debated [4-6].
Overt thyroid disease is associated with atherosclerotic cardiovascular disease; this is an unambiguous sign of overt hypothyroidism [7,8] and results from hypercholesterolemia and elevated blood pressure. However, whether subjects with subclinical hypothyroidism, defined as an elevated serum TSH and normal range of fT4, have such adverse cardiovascular disease remains uncertain and controversial. Several studies have reported that serum cholesterol level is elevated in patients with subclinical hypothyroidism [9,10] and is reversed by L-thyroxine treatment [10,11]. Another report suggested that the lipid profile of hypercholesterolemic patients with TSH levels between 2 and 4 mU/L, currently regarded as a normal TSH concentration, improved after low-dose L-thyroxine treatment [12]. Considering that metabolic syndrome represents a cluster of cardiovascular risk factors and that subjects who are at risk for developing cardiovascular disease are euthyroid, whether TSH contributes to metabolic syndrome should be investigated.
In this study we report the TSH reference range in a Korean population and the metabolic significance of TSH concentration. We aimed to investigate the factors associated with TSH concentration and the relationship between TSH and lipid concentration. We also evaluated the impact of TSH concentration on the prevalence of metabolic syndrome.
METHODS
Participants
From January to December, 2006, 12,143 subjects were recruited from the medical examination center at the CHA Bundang Medical Center in Korea. All subjects (male, 57.3%; female, 42.7%) were older than 19 years and in good health, and none was pregnant. All completed a health questionnaire that included smoking, alcohol use, menopausal status, past medical history, and the use of thyroxine or antithyroid and lipid lowering medication. Hospital records were also checked to identify and exclude patients with serious systemic diseases not reported in the questionnaire. Among 12,143 subjects, 4,161 lacking a fT4 or lipid profile, 109 reported to have had thyroid disease, 503 who showed thyroid dysfunction, and 100 who were taking anti-hyperlipidemic medication were excluded. Finally, 7,270 subjects were included in the analysis.
Definitions
Euthyroidism was defined as a TSH within the reference range of 0.35-5.5 mU/L and fT4 within the reference range of 0.89-1.76 ng/dL (to convert to pmol/L, multiply by 12.871). Height and weight were measured with participants in light clothing wearing no shoes and was recorded to the nearest 0.1 cm and 0.1 kg. Waist circumference was measured at the midpoint between the lateral iliac crest and the lowest rib. Body mass index (BMI) was calculated as weight in kilograms divided by the square of height in meters. Obesity was defined as a BMI Ōēź 25 kg/m2, as proposed by the Asia-Pacific obesity guidelines [13].
Smoking status at baseline was defined as never, previous, or current smoking. Blood pressure was measured at the right upper arm with a random-zero mercury sphygmomanometer in the sitting position. Seasons were defined as follows: spring, from March to May; summer, from June to August; fall, from September to November; and winter, from December to February. According to the Adult Treatment Panel (ATP) III criteria [14], metabolic syndrome was defined as the presence of any three of the following: waist circumference greater than 90 cm in males or 80 cm in females, triglycerides of 150 mg/dL (1.7 mmol/L) or more, high-density lipoprotein (HDL) cholesterol less than 40 mg/dL (1.0 mmol/L) in males or 50 mg/dL (1.3 mmol/L) in females, blood pressure of 130/85 mmHg or higher, or fasting glucose of 100 mg/dL (5.6 mmol/L) or higher.
Laboratory analysis
All blood samples were drawn from an antecubital vein after at least 10 hours fasting. TSH and fT4 levels were analyzed using a commercial chemiluminescent assay (Advia Centaur, Bayer, Tarrytown, NY, USA). Fasting blood glucose, total cholesterol, triglyceride, and HDL cholesterol levels were assayed using an enzymatic method (Roche Diagnostics, Mannheim, Germany). Low-density lipoprotein (LDL) cholesterol was calculated using Friedewald's formula.
Statistical analysis
Data are expressed as the mean ┬▒ SD unless otherwise stated. An independent-sample t test was used for each comparison between two independent groups. Analysis of variance (ANOVA) with post hoc analysis according to Tukey was used to compare data among age groups and seasons. Multiple linear regression was used for association between lipid profile and TSH concentration with and without adjustment for age, sex, smoking status, obesity, menopause status, and season. Multiple regression analysis was used to assess the independent association between TSH and serum lipid profile, adjusting for various risk factors. To examine the effect of TSH concentration on metabolic syndrome, the cohort was further categorized into five groups according to TSH concentration and analyzed by logistic regression. For all analyses, overall p values for trends are reported, and significance was assumed at p < 0.05. Analyses were conducted with SPSS version 11.0 (SPSS Inc., Chicago, IL, USA).
RESULTS
Population characteristics and TSH concentrations
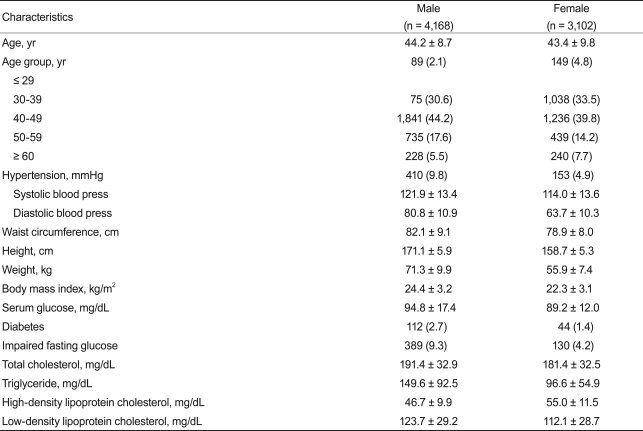
The characteristics of the 7,270 subjects are shown in Table 1. We studied 4,168 males and 3,102 females aged 20-89 years. Age distribution was similar in males and females. The mean TSH level of the study population was 1.82 ┬▒ 0.95 mU/L (median, 1.62). The TSH concentration in males was significantly lower than that in females (1.67 ┬▒ 0.87 vs. 2.02 ┬▒ 1.01 mU/L, respectively, p < 0.001). The TSH distribution was skewed toward the high end; the distribution pattern in males and females was similar (data not shown). When the 2.5 and 97.5 percentiles were calculated, 95% TSH reference limits were 0.52-4.29 mU/L (Fig. 1).
Factors associated with TSH concentration
Table 2 shows the association of TSH concentration with multiple factors. Subjects were divided into five subgroups according to age. As expected, those over 60 years had higher TSH concentrations than other age groups (p < 0.01), although TSH concentration difference among each age group younger than 60 years old was not statistically significant. Also, TSH during winter was significantly higher than during other seasons (spring, 1.79 ┬▒ 0.93 mU/L; summer, 1.74 ┬▒ 0.93 mU/L; fall, 1.78 ┬▒ 0.92 mU/L; winter, 2.09 ┬▒ 1.06 mU/L; p < 0.01). Obese males had a higher TSH concentration than did non-obese males (2.00 ┬▒ 1.00 vs. 1.63 ┬▒ 0.84 mU/L; p < 0.01). However, this was not observed in females, though there was a tendency toward a higher TSH in obese women (2.09 ┬▒ 1.05 vs. 1.73 ┬▒ 0.93 mU/L, p = 0.064). Postmenopausal females showed a slightly higher TSH concentration than did premenopausal females (2.12 ┬▒ 1.09 vs. 2.00 ┬▒ 0.99, p < 0.01).
Serum lipid profile
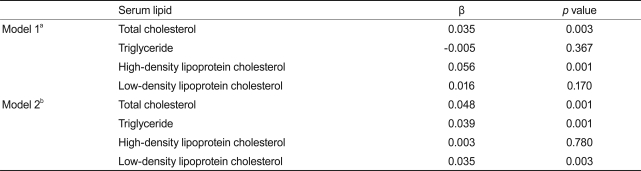
Table 3 shows the association between serum TSH within the reference range and lipid concentration. There was a significant positive correlation between TSH and total cholesterol (p = 0.003). After adjustment for age, sex, season, menopause status, and obesity, we found clear positive correlations of TSH with total cholesterol (p = 0.001), triglyceride (p = 0.001), and LDL cholesterol (p = 0.003), but not HDL cholesterol (p = 0.780).
Metabolic syndrome
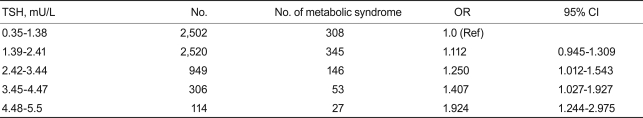
The overall percentage of metabolic syndrome in euthyroid subjects according to the ATP III definition was 12.9 and 11.0% in males and females, respectively. Table 4 shows the prevalence of metabolic syndrome in five groups stratified by TSH concentration. The percentage of subjects with metabolic syndrome consistently and significantly increased with TSH concentration (p < 0.05).
DISCUSSION
The definition of the normal range of serum TSH remains controversial. This issue is important because the normal range provides a framework to categorize patients as normal or as having subclinical or overt thyroid disease.
We report the findings of our population-based study on the reference range of TSH concentration and the association of TSH with lipid concentration and metabolic syndrome. TSH was negatively correlated with lipid concentration after adjustment for factors that can affect its concentration. Furthermore, we found that participants with high-normal TSH levels had an almost two-fold higher risk of metabolic syndrome compared to those within reference group. These findings are consistent with the well-established relationship between overt hypothyroidism and lipid concentration [15]. Several epidemiologic studies have shown that increased lipid concentration is associated with (subclinical) hypothyroidism; this explains the increased prevalence of cardiovascular disease in patients with (subclinical) hypothyroidism [7,9,16,17]. These phenomena are obvious in hypothyroidism but remain controversial in subclinical hypothyroidism. This argument raises the question of the normal range of TSH concentration [5,6,18].
The lower limit of TSH is less debated; most discussions are of how to define the upper limit of TSH, suggesting that the upper normal limit should be decreased to 2.5 mU/L [19]. A growing body of literature describes the adverse effects of subclinical thyroid disease and the benefits of T4 treatment [20-23]. Moreover, new National Academy of Clinical Biochemistry (NACB) guidelines state that more than 95% of healthy, euthyroid subjects had a serum TSH concentration of 0.4-2.5 mU/L [19]. The mean TSH concentration in our study was 1.81 ┬▒ 0.95 mU/L; this is lower than the median value, and the distribution curve was skewed to the right. Total cholesterol, triglyceride, and LDL cholesterol levels increased with TSH level within the reference range, as did the prevalence of metabolic syndrome. It is noteworthy that the positive association between serum lipid levels and TSH concentration was still significant after adjustment for several confounding variables such as age, sex, and obesity. Our study emphasized that people who are categorized as being euthyroid are susceptible to metabolic syndrome, itself a cluster of cardiovascular risk factors. Increased TSH concentration, even within the currently accepted reference range, may have long-term detrimental effects on cardiovascular health. Therefore, subjects with high normal TSH should be carefully assessed for early thyroid dysfunction, which is a risk factor for atherosclerosis.
TSH can be influenced by several factors. TSH shows diurnal variation, being high at night and low in the morning [24]. Fasting status [25] and estrogen [26] also affect TSH levels. However, conflicting factors such as fasting status or diurnal change were excluded in our study because all blood samples were taken at 8-10 AM, after fasting. Thyroid dysfunction in the elderly is more prevalent than in the young [27]. Moreover, the prevalence of thyroglobulin antibodies and thyroid peroxidase antibodies increases with age, according to the NHANES III report [27]. Therefore, our report of increased TSH concentration in subjects above 60 years is consistent with these data.
Data in the United States National Health and Nutrition Examination Survey (NHANES) suggested that TSH levels differ between Blacks and Whites in the US [28]. Several epidemiologic studies have reported the normal range of TSH concentration in the Korean population [29-32]. These studies show a slightly different TSH reference range from that in American or European populations. Lee et al. [29] reported 0.39-3.68 mIU/L in 317 patients, Jung et al. [30] 0.34-3.28 mIU/L, and Jang et al. [31] 0.47-8.76 mIU/L as a TSH normal reference range. Our study included a relatively large population and different age groups. However, further studies are required to document the normal reference range in the Korean population, and the relationship with clinical presentation should be considered.
The limitation of our study is that it was a cross-sectional, so a cause and effect relationship cannot be discerned. However, this study included a rather large number of subjects who visited our clinics for a routine health check-up and are considered to be healthy members of the general population. Also, we could not obtain data regarding thyroid autoimmunity, which represents unreported underlying thyroid disease and may influence TSH concentration. Subjects with thyroid auto-antibody positivity tend to have higher TSH concentrations regardless of ethnicity [27]. If we exclude participants who may have been antibody-positive, the TSH reference range would be narrower than that found in this study. Finally, we checked TSH only once, even though whether a single TSH measurement reflects the individual's average TSH measurement over time remains unknown.
In summary, we report a population-based TSH reference range of 0.52-4.29 mU/L in a general Korean population sample. TSH concentration was influenced by age, sex, season, menopausal status and obesity (in males only). Further, TSH concentration within the normal range was negatively correlated with serum lipid level, and high-normal TSH levels were significantly associated with an increased prevalence of metabolic syndrome. An additional study is needed to define TSH concentration and should include measurement of thyroid auto-antibody. This will provide evidence of the optimal method of treating early-stage mild thyroid dysfunction. The clinical significance of high-normal TSH levels with regard to cardiovascular prognosis should be determined in prospective studies.


 PDF Links
 PubReader
 ePub Link
 Full text via DOI
 Download Citation
 Print
Print


