


INTRODUCTION
Pulse wave velocity (PWV) measurements in human subjects have been proposed as one way to diagnose and evaluate distensibility of large arteries. As aortic stiffness is an important index that may reflect hypertension, arteriosclerosis, arterial aging, and diabetes, several methods for assessing the distensibility of large arteries have been utilized [1-6]. Among them, the least invasive systems are computerized tomography (CT), magnetic resonance imaging (MRI), and ultrasound-based equipment such as Doppler measurement, echocardiography, and high-resolution echo-tracking. However, such methods require skilled operators, have limited use in acute patients, and require specialized equipment not generally available in clinical laboratories [7,8]. Therefore, a device that is not only accurate for diagnosis but also simple to operate for routine clinical use would be advantageous.
PWV, which is inversely related to arterial wall distensibility, offers a simple and potentially useful approach for evaluating cardiovascular diseases. Despite the clinical importance and widespread use of PWV, there are no standards for pulse sensors or for system requirements to ensure accurate pulse wave measurement. Moreover, the extraction of transit time from pulse waves requires an accurate algorithm for the detection of the exact point from each pulse wave [9,10]. As the most important requirements for a PWV measurement system are the stability and reproducibility of pulse waveforms, great care must be taken in the design of pulse sensors, system hardware, and algorithms for analysis.
Sensors currently used for the measurement of pulse waves are classified largely into two types, i.e., ultrasonic Doppler sensors and pressure sensors. The latter are more comfortable and economical for clinical application, and the most widely used pressure sensors are applanation tonometry sensors. However, tonometry sensors must be used on the skin surface, which requires the removal of clothing to allow the measurement of pulse waves from the femoral or dorsalis pedis arteries. There is therefore a need for the development of a sensor that is capable of detecting pulse waves easily and without being placed directly on the surface of the skin. Moreover, as the reproducibility of the measurement is critical for diagnosis in clinical use, stable and accurate waveforms are necessary.
The most widespread method for calculating PWV uses an intersecting tangent algorithm, which detects the starting point of each pulse wave. The PWV values are calculated based on the extraction of foot-to-foot transit time, which is determined by the time difference between the upstroke points of two pulse waves obtained at two different sites [11,12]. However, pulse waves are affected by many factors, including blood pressure, heart rate, respiration, and age, which may cause changes in the shape of the waveforms [13]. For example, pulse waves from femoral arteries fluctuate according to the respiratory rhythm, and the shapes of the waveforms from such patients provide incorrect information, which may affect the detection of the correct upstroke point. Therefore, it is also important to establish an accurate algorithm that is capable of correctly detecting upstroke points from the waveform under all possible conditions.
The objective of this study was to assess the reproducibility of PWV values determined from a newly developed PWV measurement system in healthy subjects, prior to a large-scale clinical study. The study focused on the evaluation of a computerized algorithm for PWV determination using electrocardiography (ECG), phonocardiography (PCG), and the pulse waves of arteries from four different sites. The results of this study may facilitate the application of this system to the diagnosis of various types of arteriosclerosis-related vascular disease.
METHODS
The system used in this study was a PP-1000 (Hanbyul Meditech Co., Jeonju, Korea), which provides regional PWV values based on the results of ECG, PCG, and the simultaneous measurement of pulse waves from arteries at four different sites (carotid, femoral, radial, and dorsalis pedis). The ECG signals were acquired from both forceps, and the PCG sensor, designed using a piezopolymer film contact microphone, was placed on the chest. Gel-filled semiconductor pressure sensors were used for pulse wave measurements, and the housing was designed to determine the applied pulse pressure from the artery. The sensor housing was attached with Velcro to an elastic band, which could be easily strapped around the carotid, radial, femoral, and dorsalis pedis arteries. The cutoff frequency of the analog filters for pulse waves was set at 0.05-20 Hz.
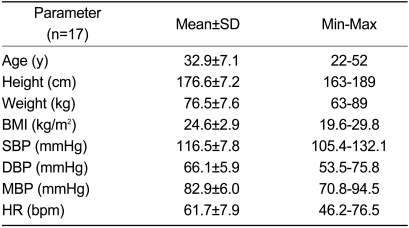
Seventeen healthy male subjects with a mean age of 33 years (range: 22-52 years) and with no cardiovascular disease participated in the present study, and data acquisition was performed at the Heart Research Institute (University Hospital of Wales, Cardiff, UK). Two observers (observers A and B) performed two consecutive measurements from the same subject, in random order. After observer A had finished two consecutive measurements from one subject, all of the sensors were detached, and observer B attached sensors again to the same subject. Six signals (ECG, PCG, and four pulse waves) from the carotid, radial, femoral, and dorsalis pedis arteries on the left side of the body were recorded simultaneously for a duration of 10 s. For the automatic determination of PWV values, the surface distance between the two recording sites of a pulse wave were measured and put into the system to allow the calculation of PWV values. Table 1 summarizes the clinical information for the participants.
After the data collection was complete, the system extracted characteristic points from each signal. The R-peaks of ECG signals were detected using a time-division adaptive threshold algorithm. In addition, discrimination between the 1st and 2nd heart sounds was performed based on the R-peaks of ECG signals, and the starting points of the 2nd heart sounds were found using the envelope detection and threshold method. In addition, peak points and dicrotic notches of carotid artery pulse waves were identified based on the features acquired from ECG and PCG. Finally, based on the time-domain scales obtained from the above values, the upstroke points of pulse waves at the carotid, radial, femoral, and dorsalis pedis arteries were detected using the intersecting tangent method.
The time difference between the upstroke points at two different sites was used to calculate the regional PWV values at the aorta, arm, and leg. The aortic PWV represents the velocity between the carotid and femoral arteries. The arm PWV and leg PWV were calculated based on the carotid-radial and the femoral-dorsalis pedis pulse transit times, respectively. To evaluate the reproducibility of the system, both within-observer and between-observer analyses were performed. The results are expressed as mean difference±2 SDs, as described by Bland and Altman [14]. Correlation coefficients, regression equations, and standard errors were acquired by linear regression analysis using SPSS 10.0 (SPSS Inc., Chicago, IL).
RESULTS
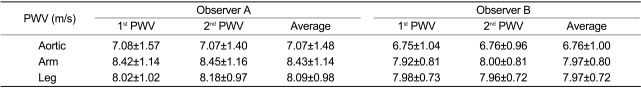
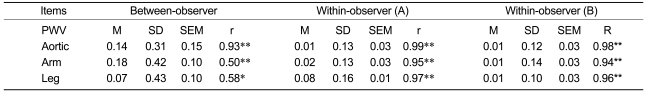
The regional PWV values for the aorta, arm, and leg (mean±SD; Table 2) were 7.07±1.48, 8.43±1.14, and 8.09±0.98 m/s as measured by observer A and 6.76±1.00, 7.97±0.80, and 7.97±0.72 m/s by observer B, respectively. There was no trend in the variation with respect to the underlying mean values and no systematic bias. Table 3 summarizes the results regarding reproducibility, including mean differences and standard deviations, standard errors, and correlation coefficients for each regional PWV value for the between-and within-observer studies.
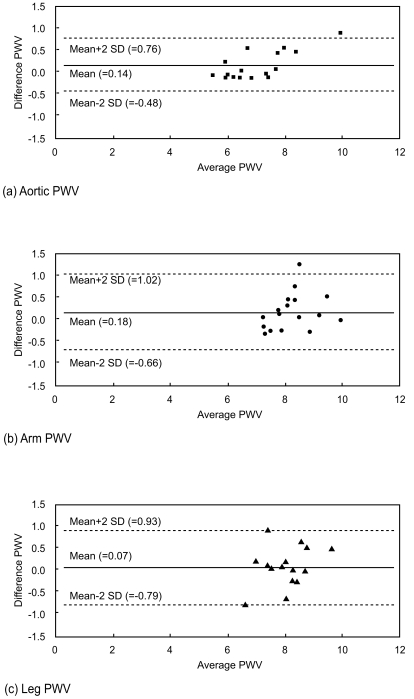
Between-observer reproducibility was analyzed using Bland-Altman plots, with reproducibility expressed as the mean difference and standard deviation between the measurements obtained by the two observers (Fig. 1). The between-observer differences (means±2 SD) for aorta, arm, and leg were 0.14±0.62, 0.18±0.84, and 0.07±0.86 m/s, and the correlation coefficients were significant, especially for aortic PWV (r=0.93).
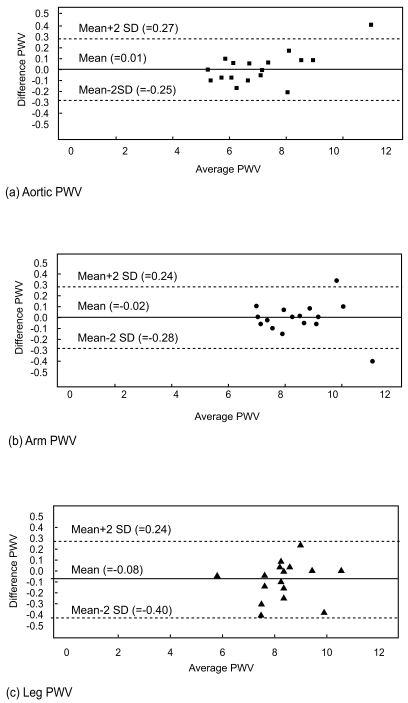
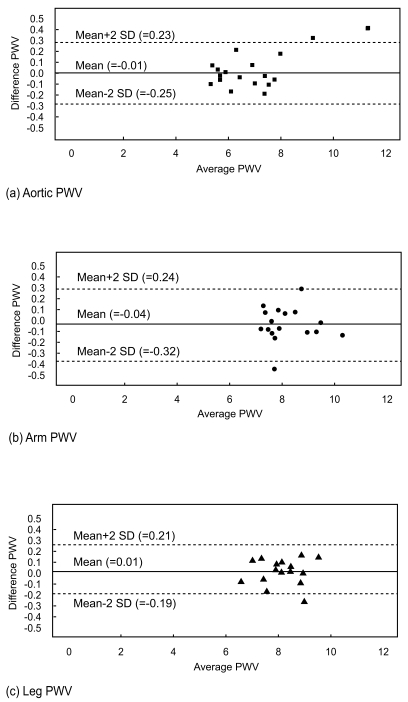
The reproducibility of regional PWV values for two consecutive measurements from the same subject was also analyzed using Bland-Altman plots. The within-observer differences for observers A and B are shown in Figures 2 and 3, respectively. Within-observer differences (means±2 SD) for aorta, arm, and leg were 0.01±0.26, 0.02±0.26, and 0.08±0.32 m/s for observer A and 0.01±0.24, 0.04±0.28, and 0.01±0.20 m/s for observer B, respectively. All of the measurements showed significant correlation coefficients, ranging from 0.94-0.99.
DISCUSSION
Bland and Altman reported a statistical approach for assessing agreement between two values measured by two different methods, with reproducibility expressed as the mean and SD of the difference between the values for the two methods [14]. They recommended a 95% confidence interval (mean difference±2 SD) to show how far apart the measurements by the two methods would likely to be for most individuals. Asmar et al. assessed the automatic PWV measurement of arterial distensibility, comparing the accuracy and reproducibility of automatic PWV measurements with those of manual calculation [15]. Wilkinson et al. analyzed the mean differences and SD of PWV values between different subjects and observers [16]. In the present study, PWV values were compared by intraobserver and between-observer methods to evaluate the reproducibility of a newly developed PWV measurement system, and the results are expressed based on Bland-Altman plots.
Between-observer reproducibilities in the present study were 0.14±0.15, 0.07±0.10, and 0.18±0.10 m/s for aortic, leg, and arm PWVs, respectively, with reproducibility coefficients (2 SD) of ±0.62, ±0.86, and ±0.84 m/s, respectively. The agreement and repro-ducibility of between-observer values were higher in the present study than in previous studies of aortic and brachial PWVs using applanation tonometry [16,17]. Within-observer reproducibilities (mean±SEM) using consecutive measurements by one observer were 0.01±0.03 and 0.01±0.03 m/s for aortic PWV, 0.08±0.04 and 0.01±0.03 m/s for leg PWV, and 0.02±0.03 m/s and 0.04±0.03 m/s for arm PWV. The reproducibility coefficients were in the range of 0.21-0.32 m/s for all regional PWVs. Within-observer reproducibility was higher than between-observer reproducibility in the present study, possibly because of more consistent placement of the sensors.
The newly developed system showed high reproducibility as evaluated by both between-observer and within-observer methods. Operation errors caused by the observer were removed because the sensors for obtaining pulse waves were designed to minimize motion artifacts. Moreover, the system used a precise algorithm for detecting the important characteristics of the pulse waves, yielding accurate PWV values. Furthermore, the system provided regional PWV values by measuring pulse waves from arteries at different sites. This study could be extended by comparing PWV values from patients with various vascular risks, including arteriosclerosis, dyslipidemia, and hypertension, for clinical application.
 PDF Links
 PubReader
 ePub Link
 Full text via DOI
 Download Citation
 Print
Print


