


INTRODUCTION
Glutathione (GSH) is a cysteine-containing tripeptide (glutamylcysteinyglycine) that plays a wide variety of physiological roles, including regulation of signal transduction and intracellular defense against oxidative stress1). GSH deficiency and oxidative stress have been associated with a series of debilitating diseases such as Parkinson's disease2, 3), Human immunodeficiency virus (HIV) infection4, 5), ischemic heart6, 7), and acute paraquat intoxication8, 9).
Among them, the clinical course of acute paraquat intoxication is one of the most critical because it progresses fast and most patients die within few days. An early observation by Bus et al.10) was that depletion of GSH enhanced paraquat toxicity. Furthermore, the evidence that GSH peroxidase plays a key role in protecting animals against paraquat toxicity has been shown in recent studies on transgenic mice11). However, the antioxidant effectiveness of exogenous GSH has been hindered by its rapid hydrolysis in the circulation and its inability to cross cell membranes12, 13). Synthesis of GSH occurs intracellularly from its constituent amino acids, via the reactions of the gammar.glutamyl cycle. In this setting, the availability of cysteine (Cys) is considered to be the rate.limiting step of GSH synthesis14), and the control point in GSH synthesis appears to be the gamma.glutamyl Cys synthetase reaction, which is subject to feedback regulation by GSH15, 16). Nacetylcysteine (NAC), a prodrug that supplies bioavailable Cys necessary for replenishment, is routinely administered to overcome pharmacologically induced GSH deficiency, for example due to acetaminophen17) or cyclophosphamide18) overdose. Other studies19, 20) have suggested that NAC is an effective means for preventing or reversing the GSH deficiency in HIV infection. Similarly, Hoffer et al.21) incubated NAC with type II alveolar cells, and showed enhanced GSH content and prevention of paraquat.induced cytotoxicity.
In clinical practice, glutathione and NAC are two of the most commonly used antioxidants in intravenous administration.
Unfortunately, there is no practical guideline outlining how much of such antioxidant should be prescribed to facilitate the rapid increase in the antioxidant capacity of the patient in an urgent situation like paraquat intoxication.
However, despite frequent use and the considerable amount of clinical knowledge on NAC, many questions remain, especially about its optimal dose.
Although Cys is a critical amino acid in the synthesis of GSH, it is very reactive in circulation and most Cys is oxidized immediately to cystine (Cys2) when it is administered intravenously.
Recently we found that extracellular methionine (Met) is as strong an antioxidant as Cys against the intracellular ROS produced by paraquat. In humans, this essential sulfurcontaining amino acid is metabolized in the trans.sulfuration pathway22): it is successively converted to S.adenosylmethionine, S adenosyl homocysteine, and homocysteine. Homocysteine lies at a branch point from which sulfur metabolism can be controlled; it can either be remethylated to Met or converted to Cys via cystathione. The remethylation of homocysteine is catalyzed by betaine homocysteine methyltransferase and 5 methyltetrahydro folate homocysteine methyltransferase. In this setting, Cys2 has been shown to increase the activity of betaine homocysteine methyltransferase23-25). Accordingly, one of the potential functions of extracellular NAC is as a source of both Cys and Met in the overall sulfur.containing amino acid balance. Therefore, it seems reasonable that practical guidelines for NAC dosage should be derived from pharmocokinetic studies of sulfur-containing amino acids synchronized with the changes in NAC following intravenous administration of NAC.
In light of the antioxidant effect of both Cys and Met, and the metabolic interrelationships between Met, Cys, and Cys2, we hypothesized it would be more accurate to estimate the antioxidant effect of NAC based on the change in plasma concentrations of each sulfur containing amino acid.
The purpose of this study was to observe changes in GSH, Cys, Cys2, and Met folowing intravenous administration of NAC to determine the adequate loading and maintenance doses of NAC for patients suffering from acute ROS-induced injury.
MATERIALS AND METHODS
Study design
This study is composed of three parts. The first is an in vitro examination using Swiss 3T3 fibroblasts to determine the concentration of extracellular NAC, Cys, Cyst2, and Met at which more than 50% of the intracellular ROS raised by paraquat is suppressed. The second part is a pharmacokinetic study performed on humans to set the loading and maintenance doses of reduced NAC. The third part is to observe changes in plasma concentration of GSH, Cys, Cys2, and Met, following intravenous administration of NAC.
An Investigational Review Board at Soonchunhyang Chunan Hospital approved this experimental study. All subjects provided written informed consents, and participation was voluntary. All reagents were obtained from SIGMA Chemical (St. Louis, Missouri, USA) unless otherwise stated.
Measurement of Intracellular ROS
Intracellular ROS was measured at a paraquat concentration of 500 ┬ĄM after an incubation period of 40 minutes at various concentrations of NAC, Cys, and Cys2. For the last 5 minutes of the stimulation, 5 ┬ĄM of H2DCFDA (dichlorofluorescein diacetate) was added to measure intracellular ROS. The amount of intracellular ROS was measured following the procedures outlined by Koo et al.26). Cultured cells on round cover slips were stabilized in a serum free medium without phenol red for a minimum of 30 minutes and then stimulated with paraquat for varying periods of time. ROS generation in cells was assessed using a DCF probe (2-7 dichlorofluorescein). During the last 5 minutes of stimulation, the membrane permeable diacetate form of the dye was added to the perfusate at a final concentration of 5 ┬ĄM. Within the cell, esterases cleave the acetate groups from DCF diacetate, thus trapping the reduced probe intracellularly. ROS in the cells oxidize DCF, yielding a fluorescent product DCF.
Intensity values are reported based on initial values, after subtracting background values. The cells were then immediately observed by a laser scanning confocal microscope (LSM410, Carl Zeiss). The samples were excited by a 488 nm Ar laser and images were filtered by a long pass 515 nm filter.
In our preliminary study, paraquat produced ROS in Swiss 3T3 between 50-500 ┬ĄM with a dose dependant pattern at 30-60 minutes. The cells remained alive in a paraquat concentration of less than 500 ┬ĄM. However, they detached within 30 minutes in a paraquat concentration of over 600 ┬ĄM or when exposed to an incubation time of over 60 minutes at lower concentration. Therefore, we selected the optimal condition for our experiments to be 500 ┬ĄM for 30 minutes.
Blood sampling for Pharmacokinetics of NAC
Seven volunteers were participatingparticipated forin the pharmacokinetic study of NAC. They were medical students aged 22 and 23 years. Their mean body weight was approximately 60 kg. Subjects ate a regular diet withoutthat did not include any alcohol or any kinds of drugs including vitamins, for more than 3 days prior to the study. An indwelling intravenous catheter was placed into an antecubital vein and 25mg/kg of NAC (N acetylcysteine, Korea United Pharm. INC., Seoul Korea) was infused in 10 min. Blood samples were obtained just prior to the infusion of NAC (basal) and at 10 min, 20 min, 30 min, 60 min, 120 min, 180 min, 360 min, and 720 min, following the bolous intravenous administration of NAC. Plasma was separated in a tube containing ethylenediamine tetraacetic acid and stored in -70Ōäā until assay.
The pharmacokinetics of NAC were characterized by peak plasma concentration (Cmax), time to Cmax (tmax), elimination of half life (t1/2), and the area under the plasma concentration time curve (AUC). The elimination rate constant (ke) was determined by linear regression analysis of the log.linear part of the concentration.time curve. The t1/2 was calculated by the equation t1/2=Ln2/Ke. The AUC was calculated by the linear trapezoidal rule for the plasma concentration.time curve. All areas were calculated over the first 12 h and, when necessary, extrapolated to infinity. The area under the first moment of the concentration.time curve (AUMC), defined as the area under the curve of the product at time t and plasma concentration Cp, from zero to infinity, was also calculated up to 12 h with the aid of the trapezoidal rule. The mean residence time (MRT) was calculated as AUMC/AUC. The volume of distribution (Vss) after the intravenous dose was calculated as Dose┬ĘAUMC/(AUC)2. Total body clearance (CL) after intravenous administration was calculated as dose divided by AUC.
Loading dose=desired plasma level x volume of distribution at steady state, infusion rate=desired plasma level x clearance (volume/unit time).
Cys, Cys2, and Met, in plasma were analyzed by the Pico Tag method (Waters, Milford, USA) after drying of the serum at the Korea Basic Science Institute at Daejeon27). Derivatization of the free amino acids samples was accomplished using a derivatizing solution (Ethanol/DW/Triethylamine/Phenylisolthiocyanate, 7/1/1/1, v/v) for 15 min. Phenylisolthiocyanate-derivatized free amino acids were applied to a 30 cm Pico.Tag Free Amino Acid Analysis column (3.9├Ś300 mm) equilibrated with buffer A, equipped with a Waters Breeze HPLC system (1525 Binary HPLC pump, 717 plus autosampler, 2487 Dual ╬╗ Absorbance detector, and Breeze version 3.20 software) and eluted with a linear gradient composed of buffer B (0, 14, 20, 46 and 100%) at a flow rate of 1 ml/min at 46Ōäā. Absorbance was measured at 254 nm. Buffer A was 140 mM sodium acetate (6% acetonitrile), and buffer B was 60% acetonitrile.
Plasma proteins in 1 mL of plasma were immediately precipitated by 0.2 mL perchloric acid (2.3 M) containing dithiothreitol (7├Ś10-3 M). The supernatant was stored at -70Ōäā. The reduced NAC was measured by a direct injection of the deproteinized plasma into a chromatographic system28). The oxidized forms of NAC, coupled to small sulphides, were determined after the reductive cleavage of all NAC disulphides in the deproteinized plasma29).
GSH measurement was carried out with a slight modification to the procedures described previously30, 31). Briefly, 0.1 mL of serum was mixed with 0.1 mL of 25 mM dithiothreitol and 0.05 mL of 0.1 M Tris, pH 8.5 for total glutathione measurement. The mixture was incubated for 30 min at 0Ōäā. After the incubation, 0.8 mL of 6% metaphosphoric acid was added and the proteins were precipitated by centrifugation for 7 min at 10,000 g and 4Ōäā. For the reduced glutathione, 0.1 mL of serum was diluted with 0.4 mL of 6% metaphosphoric acid and centrifuged under the same conditions described above. Each 0.1 mL of supernatant was neutralized with 0.1 mL of 0.5 M sodium phosphate, pH 7.0, and 0.1 mL of the neutralized solution was mixed with 0.1 mL of ortho phthaldehyde solution, followed by incubation for 5 min at room temperature. The reaction mixture was diluted with 0.8 ml of sodium phosphate, pH 7.0 and the aliquot was analyzed on HPLC. The GSH.OPA adducts were separated on a 4.6├Ś250 mm Luna C18 column (5 um, Phenomenex, Torrance, CA) using two Waters 510 pumps, 717 autosampler, and 474 fluorescence detector (Milford, MA, USA), and were detected at 420 nm with excitation at 340 nm. The initial condition was 100% of solvent A, 50 mM sodium acetate, pH 6.2 at a flow rate of 0.7 ml/min, followed by a linear gradient of 0-20% B, acetonitrile (Fisher Scientific, USA) for 10 min. The total run time was 25 min and the column temperature was 30Ōäā. The amount of oxidized glutathione was calculated by subtracting the reduced from the total glutathione values.
Statistical analysis
Results are expressed as mean┬▒SD unless otherwise stated. Analysis of variance was used to detect differences in the concentration of NAC, Cys, Cys2, Met, and GSH among the sample groups obtained at indicated sampling times. If significant differences were shown in the overall analysis of variance models, subsequent multiple.comparison testing (eg, Duncan) was performed. Statistical significance was defined as p<0.05.
RESULTS
In Vitro
Effect of NAC, Cys and Cys2 on the production of ROS by PQ in Swiss 3T3
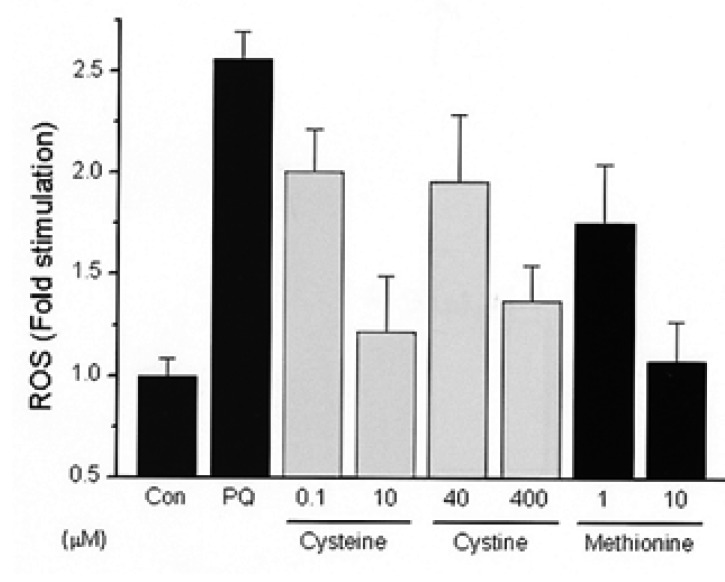
10.40 mM of NAC suppressed ROS in a dose dependant manner after an incubation period of 40 min at various concentration of NAC, Cys, and Cys2 at a paraquat concentration of 500 ┬ĄM. 10 mM of NAC suppressed about 50% of ROS and was comparable with 10 ┬ĄM of Cys and Met and 400 ┬ĄM of Cys2 (Figure 1, 2).
In Vivo
Effect of NAC on changes of sulfur containing amino acids and GSH
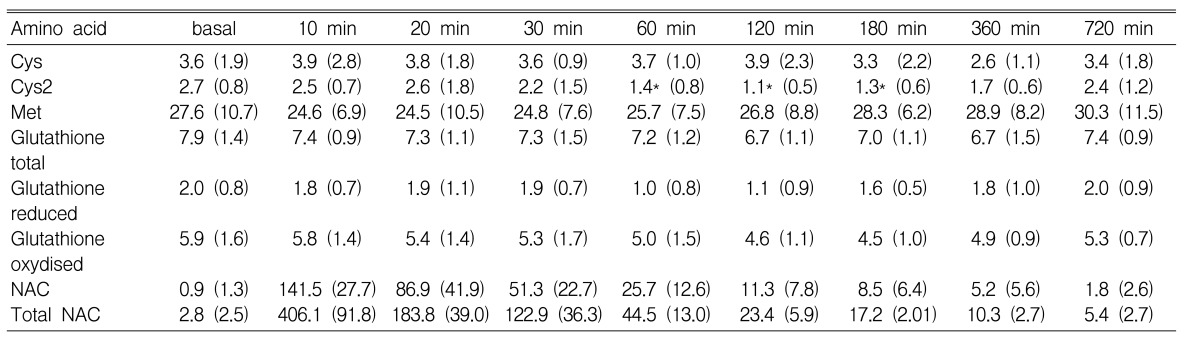
Met, Cys, Cys2, and GSH were measured over time (basal, 10, 20, 30, 60, 120, 180, 360, 720 min) following intravenous administration of 25 mg/kg of NAC. Cys2 concentrations were lower at 60, 120, and 180 min than at its basal level (p<0.05) (Table 1). However, there were no changes in the concentration of both Cys and Met during the observation period (p=0.932 and p=0.887, respectively). No significant change was observed in the concentration of total GSH, reduced GSH, and oxidized GSH (p=0.772, p=0.680, and p=0.540, respectively).
Pharmacokinetics of NAC
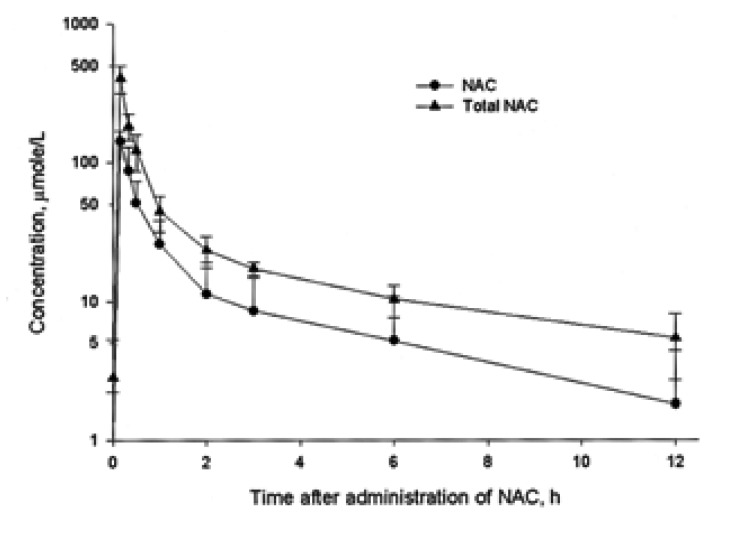
Total NAC is calculated as the sum of the reduced NAC and oxidized NAC. The mean plasma concentration of NAC versus time following intravenous administration of NAC is shown in Figure 3. Briefly, basal plasma concentrations of reduced NAC was 0.9┬▒1.3 ┬ĄM and 2.8┬▒2.5 ┬ĄM for total NAC. Peak plasma concentration was 141.5┬▒27.7 ┬ĄM for NAC and 406.1┬▒91.8 ┬ĄM for total NAC, achieved 10 min following the infusion of NAC. Semilogarithmic plots of the concentration vs. time after subtracting the basal concentration showed a monoexponential decline. Therefore, the kinetics were considered to follow a first-order one compartment model.
The t1/2 was 2.88┬▒1.14 h for NAC and 3.68┬▒1.84 h for total NAC. The CL was 1.23┬▒0.77 L h-1 kg-1 for NAC and 0.56┬▒0.27 L h-1 kg-1 for total NAC.
The Vss was 3.07┬▒0.10 L kg-1 for NAC and 3.00┬▒0.11 L kg-1 for total NAC.
If the target concentration of NAC in plasma is 10 mM, the loading and maintenance doses were 5010 mg kg-1 and 2250 mg min-1 kg-1, respectively.
DISCUSSION
Acute paraquat intoxication causes a rapid progression of ROS injuries and as a result, leads to death within a few days in most patients. In cases such as this, intravenous administration of antioxidants is the key step in early therapy, with NAC being one of the most commonly used antioxidants. Nevertheless, there are no practical guidelines relating to the adequate dose of NAC to cure acute ROS injuries.
Various methods can be used to evaluate the clinical effect of NAC, and yet the ultimate focus of studies should be placed on whether NAC can improve the critical situation of these patients. Most importantly, determining the optimum dose of NAC should therefore be the prerequisite in evaluating any antioxidants' effect. In general, the optimum dose is a function of the effective plasma concentration and pharmacokinetic data such as clearance, half-life, and volume of distribution for any given drug.
The effective concentration is usually defined as a range rather than a specific number and it may be described as a concentration of minimal effective, 50% suppression, and complete suppression of ROS. In our preliminary study, the requirement of NAC for complete suppression was too high to administer intravenously. Therefore we chose the target NAC concentration to be the concentration at which 50% suppression of ROS could be achieved.
This report showed that 10 mM of extracellular NAC suppresses about 50% of intracellular ROS brought about by paraquat, compared with 10 ┬ĄM of Cys and Met, and 400 ┬ĄM of Cys2. This suggests that Cys is a 40 times stronger antioxidant than Cys2 in an in vitro experiment, and that NAC itself is not an essential antioxidant until it is deacylated and converted to other sulfur compounds. NAC showed a half-life of 1.68 h, which was shorter than the reported value of 1.95 h32); the volume of distribution was higher (3.48 vs. 0.59 l kg-1) than that in the previous report32) where relatively small doses of NAC (1500 mg vs. 200 mg) were used.
NAC has quite different metabolism systems in vitro and in vivo. It is not clear whether the results from the in vitro experiments can be applied to the in vivo experiments. However, the pharmacokinetic study showed that to reach the target concentration of 10 mM, the loading and maintenance doses of NAC were 5010 mg kg-1 and 2250 mg min-1 kg-1, respectively. Clinically, it is impossible to give such a large dose of NAC intravenously. In our experiences, patients felt a burning sensation at the injection site when the intravenous NAC dose was over 6.0 g per hour. Furthermore, there is no clinical information that guarantees a patient's safety when such a large volume of NAC is administered intravenously.
NAC was deemed to be an effective antioxidant in treating critical ROS injuries, but to pinpoint the optimum dosage of NAC may be controversial. It is however probable that the optimum dosage of NAC is the upper margin of the therapeutic window.
Theoretically there are various ways to calculate the effective dose of NAC. First, as was described earlier, it is the volume of distribution and/or clearance of NAC in circulation with an effective concentration that would in large part decide the optimum dose. In this experiment, NAC immediately disappeared from circulation after the intravenous administration. This result implies a rapid metabolism of both NAC and Cys caused by deacetylation, further metabolism, and movement into other compartment including intracellular space.
An assessment of the effect of an antioxidant in vivo is complicated because thiol antioxidants have been known to act in a variety of ways, as components of the general thiol/disulfide redox buffer33), as metal chelators34), as radical quenchers35), as substrates for specific redox reactions36), and as specific reductants of individual protein disulfate bonds37).
The composition and redox status of the available thiols in a given compartment are highly variable and they must play a part in determining the metabolic activity of each compartment. Changes in the thiol redox gradient across the cells could also adversely affect any transport or cell signaling processes, which are dependent on the formation and the rupture of disulfide linkages in membrane proteins.
In this study, we put our test results in numbers for both in vitro and in vivo experiments, but they need to be better understood as specific values whose scale we set arbitrarily in our study alone rather than generally applicable values. Likewise, the metabolites of NAC, such as Cys, Cys2, and other sulfur compounds would provide powerful information if we could comprehend their precise metabolic processes. However, we only observed the epiphenomenona of sulfur containing amino acid without an intensive study of the metabolism of each amino acid. With such limitations in this study, we conclude that there was no significant increase in the concentrations of Cys, Met and GSH after the infusion of NAC. The concentration of Cys2 decreases 60 min after the NAC administration. This finding implies that NAC reacts with, and leads to the conformational transition of Cys2.
In conclusion, our results showed that the effect of NAC as an antioxidant could not be measured in terms of the NAC plasma concentration or its metabolites alone. In order to determine the optimum dosage of NAC, other methods must be established. One consideration to be investigated is measuring intracellular GSH synthesis before and after NAC administration.

 PDF Links
 PubReader
 ePub Link
 Full text via DOI
 Download Citation
 Print
Print


