


INTRODUCTION
Hypertension is a major public health problem due to its high prevalence and significant complications. It is an important risk factor for sudden cardiac death, of which the incidence increases with increases in blood pressure1).
Great attention has been given to arrhythmias in hypertensive patients. The presence and the complexity of both supraventricular and ventricular arrhythmias have been shown to influence the morbidity, mortality, and quality of life of hypertensive patients2,3). These arrhythmias have a wide spectrum which ranges from supraventricular premature complexes to ventricular tachyarrhythmia or sudden cardiac death. Multiple risk markers for an arrhythmic substrate, which can be applied to hypertensive heart disease, have been identified in different pathological cardiovascular conditions. These include diminished heart rate variability4), QT interval dispersion5), and ventricular late potentials4,6,7). A large QT dispersion indicates the presence of a substrate for ventricular tachyarrhythmias, most obviously by a mechanism of re-entry8).
The electrocardiographic QT interval is a measurement of the duration of ventricular repolarization and is sensitive to myocardial ischemia. The interlead variation in the 12-lead ECG is referred to as QT dispersion. QT dispersion is a noninvasive measurement of regional variation in ventricular recovery time.
The Valsalva maneuver is characterized by a significant increase in intrathoracic pressure which is immediately transmitted to all intrathoracic vascular structures. Ventricular arrhythmias are common in patients with volume or pressure overload, such as aortic valve disease9) or dilated cardiomyopathy 10). The intrathoracic pressure change characteristic of the Valsalva maneuver can act as a factor in the triggering of sudden cardiac death. It may be supposed that the mechanism of this event is a change in the normal sequence of repolarization which alters local electrical gradients and is potentially arrhythmogenic11). Many hypertensive patients are at increased risk for sudden cardiac death because the Valsalva maneuver may be performed 10 to 20 times an hour by patients on bed rest as they move in bed, cough, strain to evacuate stool, and carry or lift heavy materials.
However, QT dispersion during the Valsalva maneuver has not yet been properly investigated in hypertensive patients in clinical settings. Therefore, in this study, the change in QT dispersion during the strain phase of the Valsalva maneuver was investigated in hypertensive patients.
MATERIALS AND METHODS
Patients
From March to July 2003, patients were selected from among those visiting for evaluation or management of hypertension at Daejeon St. Mary's hospital. Subjects with evidence of myocardial infarction, congestive heart failure, valvular heart disease, atrial fibrillation, left or right bundle branch block, and patients receiving class I or class III antiarrhythmic agents were excluded from the study. Subjects who had been receiving any kinds of antihypertensive drugs were also excluded from the study.
Based on the criteria of JNC VII, we divided patients into two groups. Group A was comprised of patients whose systolic blood pressure (SBP) was between 140 mmHg and 160 mmHg or diastolic blood pressure (DBP) was between 90 mmHg and 100 mmHg (stage I criteria by JNC VII). Group B was comprised of patients in whom SBP was = 160 mmHg or DBP was = 100 mmHg (stage II criteria by JNC VII).
We studied 25 Group A patients (8 men and 17 women, mean age 567 years), 25 Group B (8 men and 17 women, mean age 598 years), and 25 controls (10 men and 15 women, mean age 547 years).
Valsalva maneuver
A 20-mL syringe for a mouthpart was attached via rubber tubing to a sphygmomanometer. The patient was then asked to blow hard and maintain pressure at 50 mmHg (which was marked with a board marker) for 10 seconds, and a 12-channel, 12-lead ECG was recorded at a paper speed of 25 mm/sec just prior to the release of strain.
Electrocardiography and QT analysis
Standard 12-lead ECG was recorded at a paper speed of 25 mm/sec at rest and just prior to the release of strain during the Valsalva maneuver using a MAC 5000 (Hewlett Packard Co, Andover, MA). All 12 leads were recorded simultaneously, hence, the QT interval was measured automatically from the same heart beat from the onset of QRS complex to the end of the T-wave, defined as the return to baseline using the digitized QT quad program. An average of three consecutive beats was taken for each lead. QT dispersion was calculated as the difference between maximum and minimum QT intervals. At least eight leads were required for calculation of QT dispersion.
Statistics
Data was analyzed using the SPSS statistical program (version 10.0, Chicago). Continuous data is expressed as the mean standard deviation. Comparisons between groups of discrete variables were performed using the 2 test. Continuous variables were tested with ANOVA or the unpaired Student's t-test. A value of p<0.05 was considered significant.
RESULTS
Patients characteristics
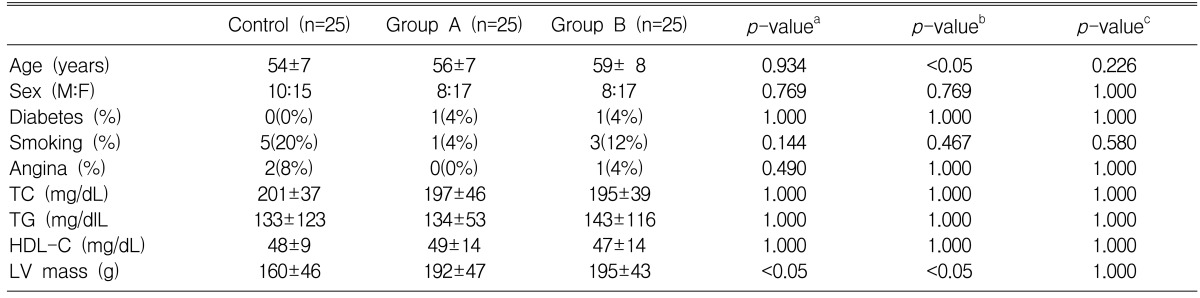
Table 1 lists a descriptive analysis of the demographic data of the enrolled patients. The study population included 75 subjects, with 25 having normal blood pressure (Control), 25 with stage I hypertension (Group A), and 25 with stage II hypertension (Group B). Patients in Group B were significantly older than controls (p<0.05). Differences in sex, smoking, diabetes, angina, and hyperlipidemia were not statistically significant between the three groups.
Electrocardiographic data
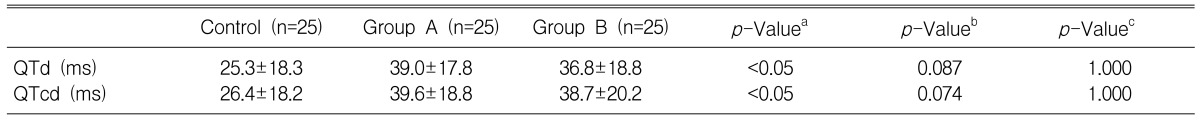
QT and QTc dispersion measurements were made on the 12-lead electrocardiogram (Table 2). The basal QT dispersion was 25.3┬▒18.3 ms in the controls, 39.0┬▒17.8 ms in Group A, and 36.8┬▒18.8 ms in Group B. QT dispersion was significantly greater in Group A patients than in controls (p<0.05). The basal QTc dispersion was 26.4┬▒18.2 ms in controls, 39.6┬▒18.8 ms in Group A, and 38.7┬▒20.2 ms in Group B. The QTc dispersion was significantly higher in Group A patients than in controls (p<0.05).
QT dispersion and Valsalva maneuver
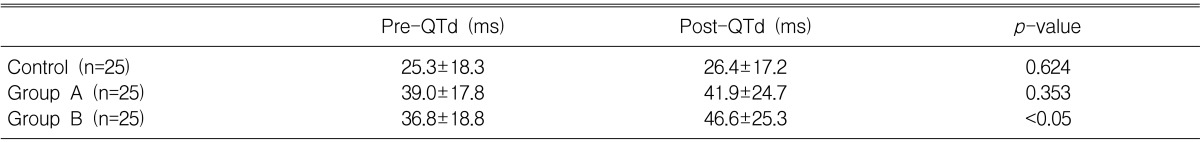
We conducted a comparison of the QT dispersion analyses of the three groups before and during the Valsalva maneuver (Table 3). In Group B, there was a significant increase in QT dispersion during the Valsalva maneuver compared with that before the Valsalva maneuver (p<0.05). In Group A and the control group, however, increases in QT dispersion during the Valsalva maneuver were not statistically significant compared to the QT dispersion before the Valsalva maneuver.
The corrected QT dispersion analyses before and during the Valsalva maneuver were also compared between the three groups (Table 4). Again, in Group B, there was a significant increase in QTc dispersion during the Valsalva maneuver compared with that before the Valsalva maneuver (p<0.05).
DISCUSSION
QT dispersion is defined as a QT interval variation in the 12-lead surface electrocardiogram and is accepted as a reflection of regional variation in ventricular repolarization12). It has been shown that increased heterogeneity of ventricular repolarization could favor the development of ventricular arrhythmias13,14). Sudden cardiac death is generally considered to be due to arrhythmia, and in patients with coronary heart disease, a strong correlation exists between abnormal wall motion and ventricular arrhythmia15).
LV hypertrophy is considered an independent risk factor for coronary artery disease and cardiovascular complications16). It has been established that coronary artery disease, stroke, and sudden death are more frequent in patients with LV hypertrophy17).
Ichkhan et al.18) suggested that the greater the LV mass, the greater the QT dispersion in hypertensive patients. When compared with patients with hypertension but without a hypertrophied myocardium, a significantly increased QT dispersion was found in the subset of patients with hypertension and LV hypertrophy. Thus, it is not hypertension per se, but LV hypertrophy that creates an increase in QT dispersion.
Oikarinen et al.19) suggested that, in hypertensive patients with electrocardiographic evidence of LV hypertrophy, increases in LV mass index and LV hypertrophy were associated with a prolonged QT interval and increased QT dispersion. These findings suggested that an increased vulnerability to repolarization-related ventricular arrhythmias might partially explain the increased risk of sudden death in hypertensive patients with increased LV mass. A recent study conducted by Oikarinen et al.20) suggested that, in hypertensive patients with electrocardiographic evidence of LV hypertrophy, regression of echocardiographically determined LV mass and electrocardiographic indexes of LV hypertrophy may partially reduce the QT interval and QT dispersion. The findings presented in this study suggest that QT dispersion, as determined for the standard electrocardiogram, shows an increase of left ventricular mass.
Clearly, the hypertrophic myocardium is a fertile ground for the development and propagation of arrhythmias, which increase the risk of sudden arrhythmic death. A major question then arises: If LV hypertrophy is regressed by effective treatment, is arrhythmic risk decreased? Karpanou et al.21) pronounced that LV hypertrophy is associated with increased QT dispersion in hypertensive patients, whereas QT dispersion can be decreased by the regression of LV hypertrophy either with angiotensin-converting enzyme inhibitors or calcium antagonist therapy.
We examined the acute effects of the strain phase of the Valsalva maneuver, and whether there were significant changes in QT dispersion that explained the arrhythmia formation and sudden death during some conditions which stimulate the Valsalva maneuver, such as constipation, severe coughing spells, vomiting, and carrying or lifting heavy objects. During the strain, the increased intrathoracic pressure obstructs systemic venous return, and the strain phase of the Valsalva maneuver is characterized by a fall in systolic blood pressure and pulse pressure, as well as a decrease in coronary ischemia22,23). Local differences in repolarization and excitability induced by a mechanism as shown by Taggart et al.24) would facilitate arrhythmias by a mechanism of re-entry. Although they were able to exclude whether these were real phenomena or artifacts, early after-depolarizations accompanied by ventricular premature contractions suggested another explanation for arrhythmia24). The findings of this study support that the Valsalva maneuver affects the prolongation of QT dispersion in hypertensive patients, especially stage II patients or patients who are severely hypertensive. This may be due to the increased strain in the myocardia of severely hypertensive patients compared to that of mildly hypertensive patients.
CONCLUSION
There are some conditions, such as constipation, severe coughing spells, vomiting, and carrying or lifting heavy objects that increase intrathoracic pressure and may increase QT dispersion. Therefore, all of these conditions should be treated appropriately and should be avoided by patients with severe hypertension.

 PDF Links
 PubReader
 ePub Link
 Full text via DOI
 Download Citation
 Print
Print


