Korean J Intern Med > Volume 37(3); 2022 > Article
Bae, Lim, Yang, Oh, Choi, Kim, Ma, Kim, Han, and Kim: Low waist circumference prior to percutaneous coronary intervention predict the risk for end-stage renal disease: a nationwide Korean population based-cohort study

Abstract

Background/Aims

The obesity paradox has been known in end-stage renal disease (ESRD). However, the effect of body mass index (BMI) or waist circumference (WC) prior to percutaneous coronary intervention (PCI) on the development of ESRD is not clear.

Methods

Using nationally representative data from the Korean National Health Insurance System, we enrolled 140,164 subjects without ESRD at enrolment who underwent PCI between 2010 and 2015, and were followed-up until 2017. Patients were stratified into five levels based on their baseline BMI and six levels based on their WC with 5-cm increments. BMI and WC were measured at least 2 years prior to PCI. The primary outcome was the development of ESRD.

Results

During a median follow-up of 5.4 years, 2,082 (1.49%) participants developed ESRD. The underweight group (hazard ratio [HR], 1.331; 95% confidence interval [CI], 0.955 to 1.856) and low WC (< 80/< 75) (HR, 1.589; 95% CI, 1.379 to 1.831) showed the highest ESRD risk and the BMI 25 to 30 group showed the lowest ESRD risk (HR, 0.604; 95% CI, 0542 to 0.673) in all participants after adjusting for all covariates. In the subgroup analysis for diabetes mellitus (DM) duration, WC < 85/80 cm (men/women) increased ESRD risk in only the DM group (DM < 5 years and DM ≥ 5 years) compared to the reference group (85–90/80–85 of WC), but not the normal or impaired fasting glucose group.

Conclusions

Low WC prior to PCI showed an increased ESRD risk in patients with DM undergoing PCI as compared to those without DM.

Graphical abstract

INTRODUCTION

The prevalence of obesity has been steadily and significantly increasing worldwide [1,2]. Because of its impact on cardiovascular diseases (CVDs), obesity is becoming one of the most serious global health issues [3]. The risk factors associated with obesity and ischemic heart disease (IHD) are well-established, and obesity itself has been thought to be a risk factor for IHD and can worsen its prognosis regardless of the metabolic status [4,5]. There is less evidence showing obesity as an independent risk factor of end-stage renal disease (ESRD), regardless on the presence of type 2 diabetes mellitus (DM) [6], and observational studies have shown positive associations between obesity and chronic kidney disease (CKD) or ESRD [7,8]. However, some studies showed that obesity did not increase the risk of ESRD in patients with moderate to advanced CKD [9]. Therefore, whether obesity is associated with the development of ESRD remains unclear.
Percutaneous coronary intervention (PCI) is an essential treatment modality for coronary artery disease. Although PCI is mainly performed in patients with underlying diseases such as DM, CKD, and hypertension, resulting in ESRD, there is insufficient data on the association between PCI and ESRD. In addition, the impact of obesity prior to PCI on ESRD risk has not been evaluated.
Therefore, we conducted this study to verify the relationship between obesity prior to PCI and ESRD risk using the National Health Insurance Service (NHIS) health checkup data.

METHODS

Because of the confidentiality of the data used for this study and strict privacy policy from the data holder that the data can be kept among the designated research personnel only, the data cannot be provided to others, even if the data are made anonymous.

Study design and database

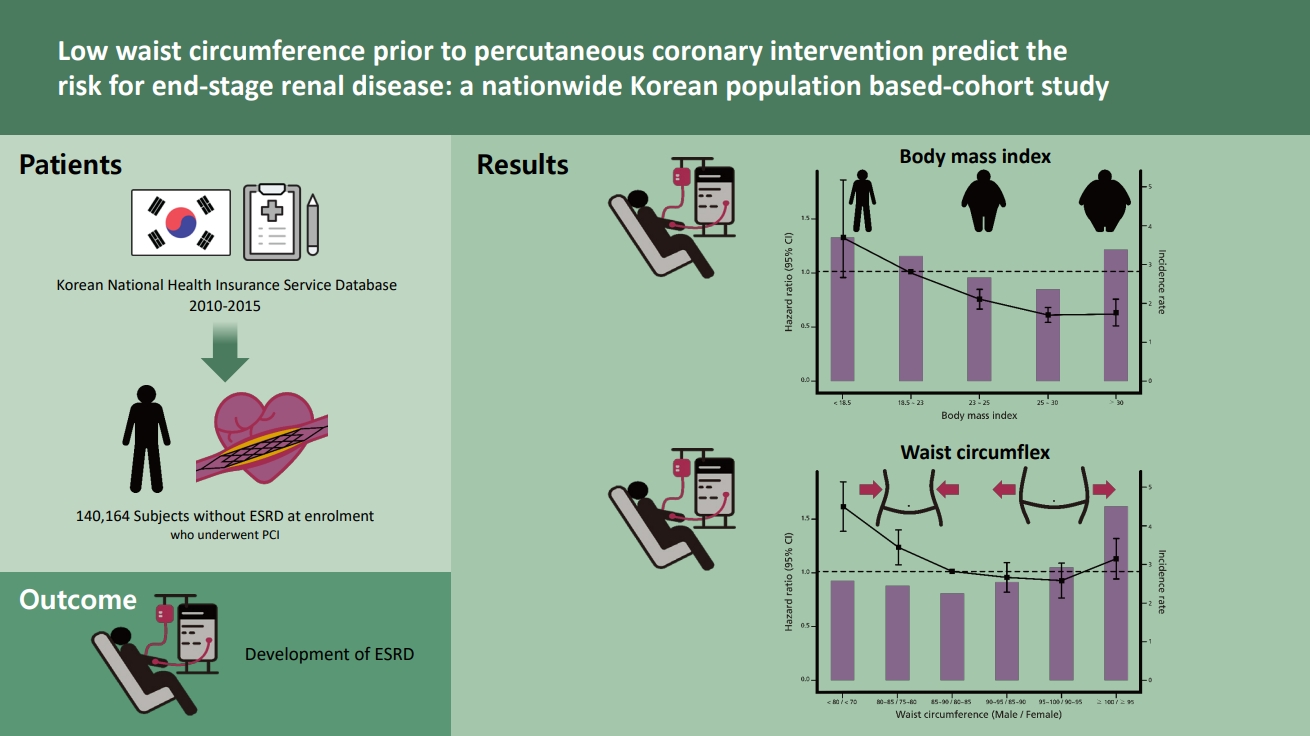
The Korean National Health Insurance Service (KNHIS) comprises a complete set of health information pertaining to 50 million Koreans, which includes an eligibility database, medical treatment database, health examination database, and medical care institution database [10,11]. The National Health Insurance Corporation (NHIC) is the single insurer, managed by the Korean government, to which approximately 97% of the Korean population subscribes. Enrollees in the NHIC are recommended to undergo a standardized medical examination at least every 2 years. Among 270,237 subjects who underwent PCI in 2010 to 2015 (index year), 143,727 subjects were followed up to 31 December 2017. We excluded 2,440 subjects with missing data for at least one variable. To avoid confounders by pre-existing diseases and minimize the possible effects of reverse causality, those who had a history of ESRD before the index year were also excluded (n = 1,123). Ultimately, the study population consisted of 140,164 subjects (Fig. 1). We registered only de novo PCI and excluded patients with a history of PCI to avoid the effects of past coronary intervention due to coronary artery disease, including angina pectoris or MI.
The study protocol adhered to the ethical guidelines of the 2013 Declaration of Helsinki and was approved by the Chonnam National University Hospital (study approval number: CNUH-EXP-2020-187) and NHIS (NHIS-2019-1-379). The need for written informed consent was waived by our review board.

Definitions of body mass index and waist circumference

For each participant, the body mass index (BMI) was calculated by dividing the weight (in kg) by the square of the height (in m2). We defined obesity as a BMI ≥ 25 kg/m2. Participants were then categorized by the definition of obesity as follows: underweight (BMI < 18.5 kg/m2), normal (≥ 18.5 to < 23 kg/m2), overweight (≥ 23 to < 25 kg/m2), stage 1 obesity (≥ 25 to 30 kg/m2), and stage 2 obesity (≥ 30 kg/m2) according to the World Health Organization recommendations for Asian populations [12].
The waist circumference (WC) of each participant was also measured at the midpoint between the rib cage and iliac crest by a trained examiner. Patients were divided into six categories based on 5-cm WC increments: < 80/< 75, 80–85/75–80, 85–90/80–85 (reference group), 90–95/85–90, 95–100/90–95, and ≥ 100/≥ 95 cm in men/women. Central obesity was defined as a WC ≥ 90 cm in men and ≥ 85 cm in women according to the definition of the Korean Society for the Study of Obesity [13].

Glycemic status and definition of chronic disease

All participants were categorized into four groups based on their glycemic status: normal, impaired fasting glucose (IFG), DM < 5 years, and DM ≥ 5 years. IFG was defined as a facing plasma glucose level of 100 to 125 mg/dL. Type 2 DM was defined as an FPG level ≥ 126 mg/dL or at least one claim per year for the prescription of hypoglycemic drug under International Classification of Diseases, 10th Revision (ICD-10) codes E11–14 [14]. Patients with type 1 DM who had claims under ICD-10 code E10 were excluded from this study [15,16]. The group with DM < 5 years was defined as who had type 2 DM with 5 years on the date of the health checkup. The group with DM ≥ 5 years was defined as those who had type 2 DM 5 years before the date of the health checkup. Comorbidities were identified using information gathered in the 1 year before the index date. Hypertension was defined as a previous hypertension diagnosis ICD-10 codes (I10–13, I15) and a history of taking at least one antihypertensive drug, or a recorded systolic blood pressure (BP) of ≥ 140 mmHg or diastolic BP of ≥ 90 mmHg in the health examination database. Dyslipidemia was identified using the appropriate diagnostic code (E78) and a history of lipid-lowering drug use, or a total serum cholesterol concentration of ≥ 240 mg/dL in the health examination database. CKD was defined as an estimated glomerular filtration rate (eGFR) of <60 mL/min/1.73 m2 calculated using Chronic Kidney Disease Epidemiology Collaboration (CKD-EPI) equation and as a combination of ICD-10 codes (N18–19). Participants’ fasting blood glucose (mg/dL), total cholesterol (mg/dL), triglyceride (mg/dL), high density lipoprotein cholesterol (mg/dL), and low density lipoprotein cholesterol (mg/dL) concentrations were measured in a fasting state. The quality of the laboratory tests has been validated by the Korean Association for Laboratory Medicine, and hospitals participating in the NHI health checkup programs are certified by the NHIS.

Study outcomes and follow-up

The study population was followed from baseline to the date of ESRD diagnosis or until 31 December 2017, whichever came first. The primary end point was incident ESRD, which was defined using a combination of ICD-10 codes (Z49, Z94.0, and Z99.2) and a special code (V code) that was assigned in the initiation of renal replacement therapy (hemodialysis [HD], V001; peritoneal dialysis [PD], V003) and/or kidney transplantation (KT, V005) during hospitalization. All medical expenses for dialysis are reimbursed using the Korean Health Insurance Review and Assessment Service database. These patients are also registered as special medical aid beneficiaries. Therefore, we were able to identify every patient with ESRD in the entire South Korean population and to analyze the data for all patients with ESRD who started dialysis. Codes for treatment or medical expense claims included V005 for KT, V001 for HD, and V003 for PD. We excluded individuals without previous CKD who had a transplant or dialysis code on the same date as an acute renal failure code. Subjects on continuous renal replacement therapy or acute PD were also excluded.

General health behaviors and sociodemographic variables

Smoking history was categorized as nonsmokers, former smokers, and current smokers. Alcohol drinking was categorized into 0, 1–2, or ≥ 3 times/week by frequency (none, mild, and heavy, respectively), and regular exercise, defined as vigorous physical activity for at least 20 min/day, was categorized into 0, 1–4, and ≥ 5 times/week by frequency. Income level was divided by quartile: Q1 (lowest), Q2, Q3, and Q4 (highest).

Statistical analysis

We report the mean ± standard deviation with intervals for continuous variables and the numbers (with percentages) for categorical variables. The hazard ratios (HRs) with 95% confidence intervals (CIs) for ESRD by BMI and WC category was obtained using multivariable Cox proportional hazard models using the normal BMI (BMI 18.5 to 23 kg/m2) and normal WC (85–90/80–85 cm) as a reference after adjustment using four models: Model 1: crude model; Model 2: adjusted for Model 1 plus age, sex, income, DM, dyslipidemia, and hypertension; Model 3: adjusted for Model 2 plus smoking, alcohol drinking, physical activity, and eGFR; and Model 4: adjusted for Model 3 plus previous CVD, heart failure, and cancer. For the Cox proportional hazard regression model, we did not subtract the deceased from the data itself to minimize possible bias when excluding mortality and morbidity.
The cumulative ESRD incidence was estimated by constructing Kaplan-Meier curves for the mean 5.4-year follow-up period, and we used the log-rank test to examine differences in ESRD development by the level of BMI and WC. We also performed subgroup analysis for DM status. A p < 0.05 was considered to reflect statistical significance. SAS version 9.3 software and SAS survey procedures (SAS Institute Inc., Cary, NC, USA) were used for all statistical analyses.

RESULTS

Baseline characteristics

Among all the participants, 2,082 (1.49%) developed ESRD during a median follow-up duration of 5.4 years. The mean age was higher among individuals who developed ESRD than among those who did not. The proportions of low income were higher in the incident ESRD than in the non-ESRD groups. Comorbidities such as DM, hypertension, dyslipidemia, CKD, proteinuria, CVD, heart failure, and cancer were more prevalent in the ESRD group than in the non-ESRD group. eGFR and BMI were lower, and BP and glucose levels were higher, in the ESRD group than in the non-ESRD group (Supplementary Table 1).
The characteristics of participants classified by BMI levels and WC are presented in Tables 1 and 2, respectively. Subjects in the underweight group (BMI < 18.5 kg/m2) were older; had a lower income; exercised less; and had a lower prevalence of DM, hypertension, dyslipidemia, and CKD, and a higher prevalence of CVD, heart failure, and cancer. The mortality rate was highest in the underweight group. BP, fasting glucose, and total cholesterol were lower in the underweight group (Table 1). Table 2 shows that the patients in the central obesity group were older; mostly women; had a lower income; exercised less; and had a higher prevalence of DM, hypertension, dyslipidemia, CKD, CVD, and heart failure. Apart from eGFR, BP, fasting glucose, and lipid levels were also higher in the central obesity group. The mortality rate was highest in the WC of < 80/< 75 (Table 2).

Association of BMI and WC with the risk of ESRD

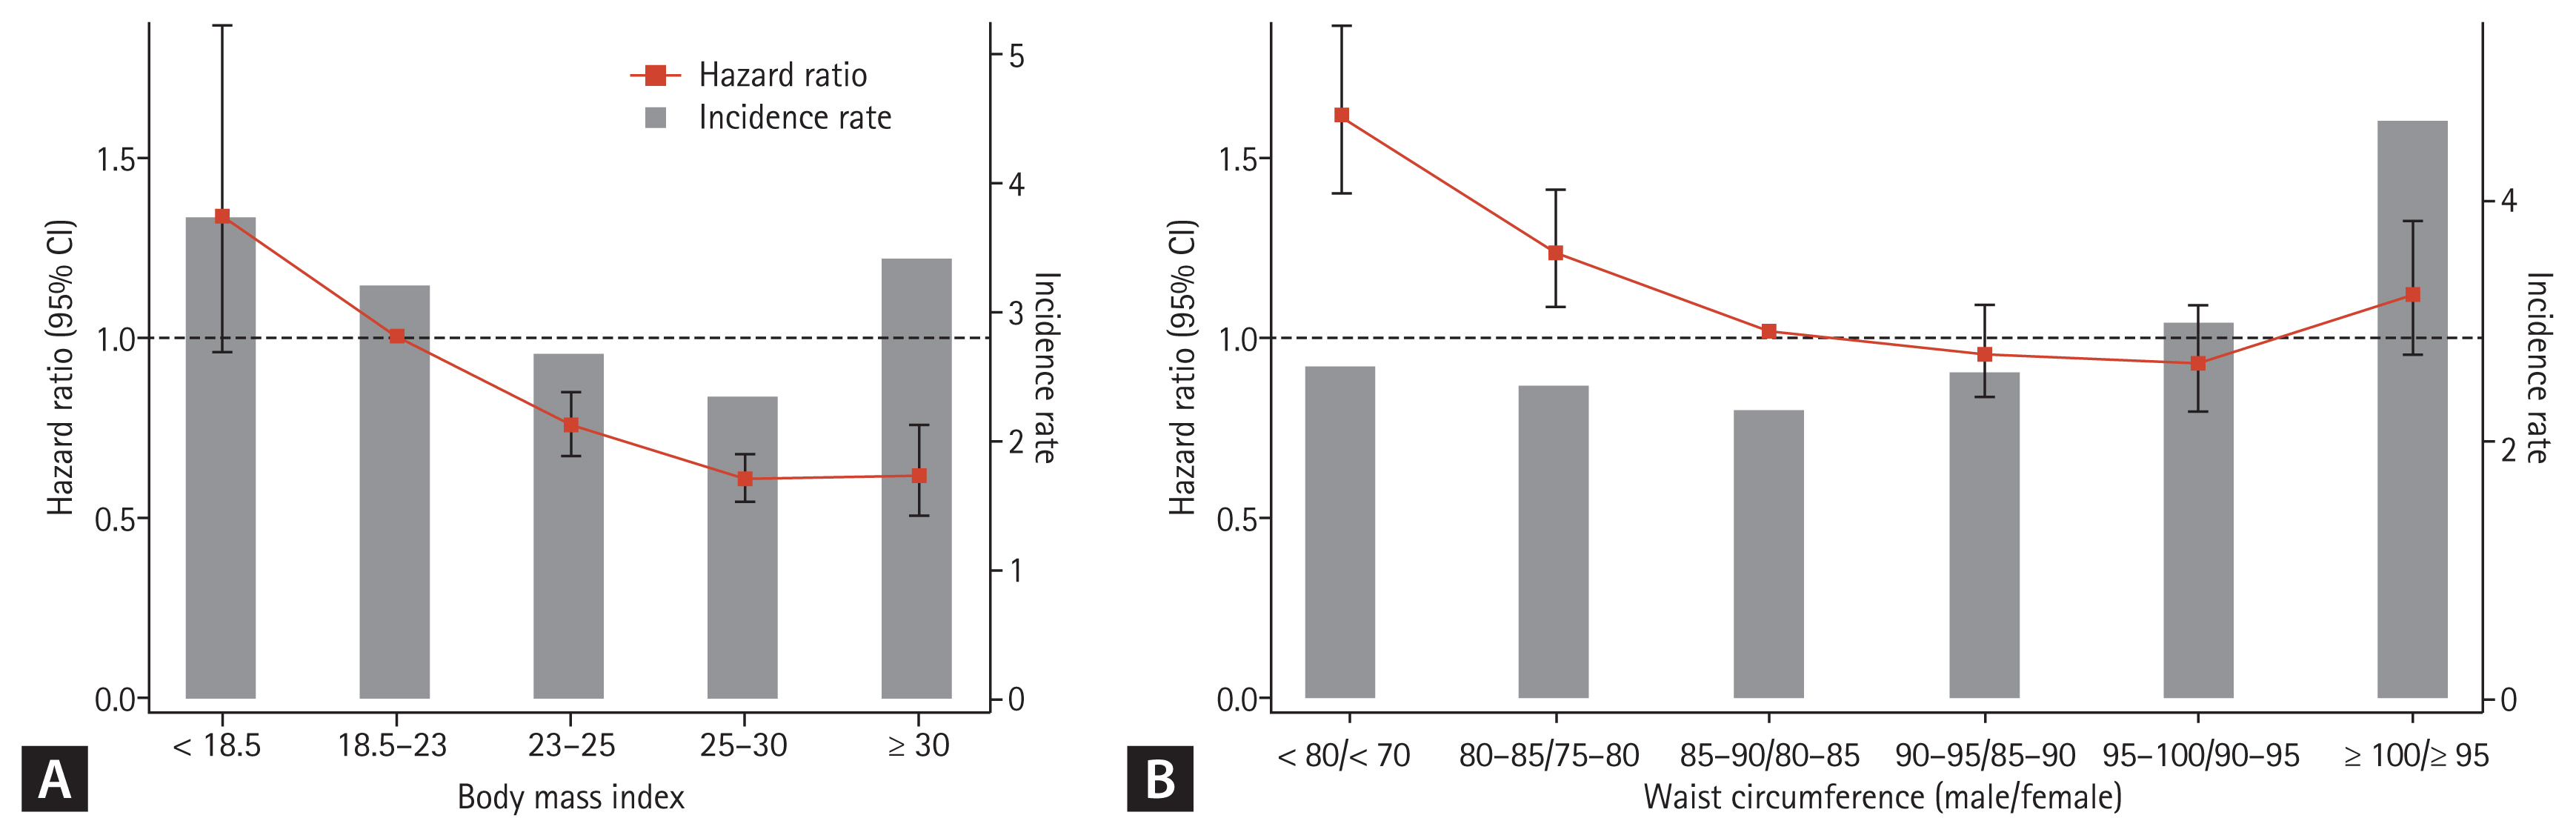
The underweight group (HR, 1.331; 95% CI, 0.955 to 1.856) and the WC < −80/−75 group (HR, 1.589; 95% CI, 1.379 to 1.831) showed the highest ESRD risk, while the BMI 25 to 30 group showed the lowest ESRD risk (HR, 0.604; 95% CI, 0.542 to 0.673) in all participants after adjusting for age, sex, income, presence of DM, dyslipidemia, hypertension, smoking, alcohol drinking, physical activity, glomerular filtration rate, previous CVD, heart failure, and cancer (Table 3 and Fig. 2). Central obesity prior to PCI tended to show a risk factor for ESRD development, but it was not statistically significant (Table 3 and Fig. 2B).

Subgroup analyses

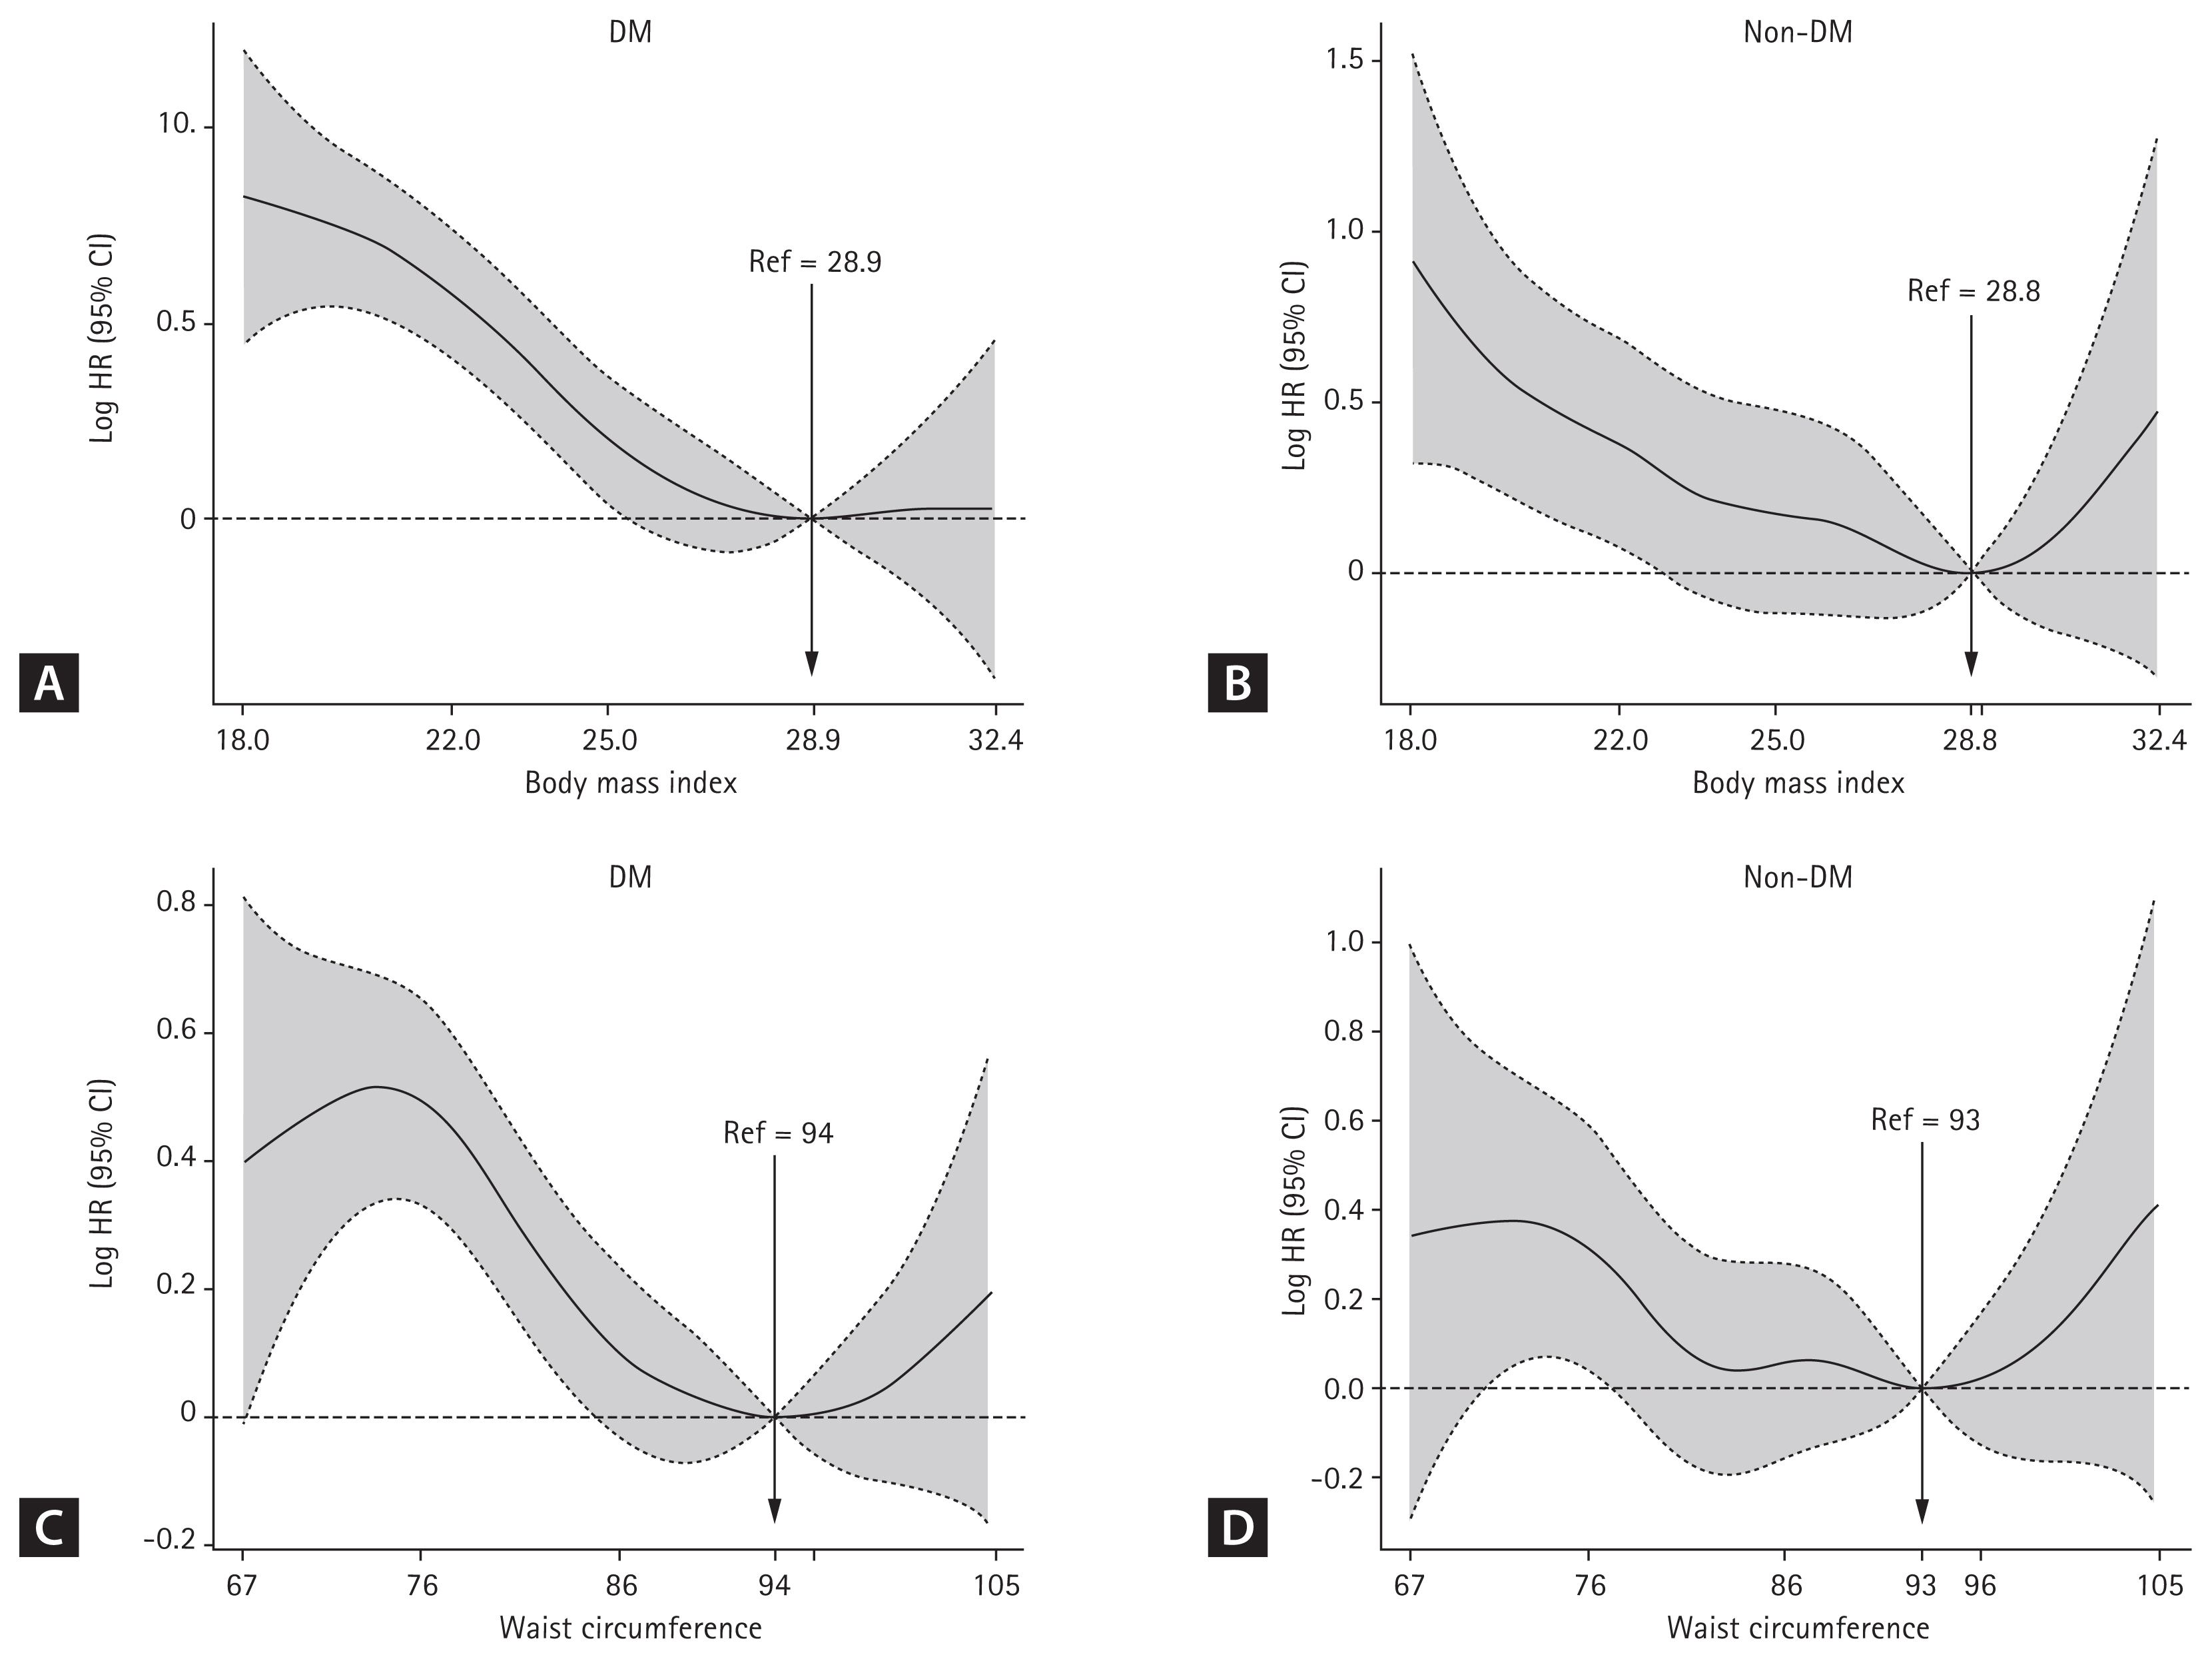
Subgroup analyses for DM and DM duration were performed. The DM group showed a reverse linear relationship with ESRD risk at BMI values below 28.9 kg/m2 (Fig. 3A) and WC values below 94 cm (Fig. 3C). However, this reverse linear relationship with ESRD risk was not statistically significant for the non-DM group (Fig. 3B and 3D).
In the DM duration subgroup analysis, the BMI level prior to PCI was not a risk factor for ESRD in all four groups after adjustment with all variables (Table 4). A WC < 85/80 cm (men/women) increased ESRD risk in only DM group (DM < 5 years and DM ≥ 5 years) compared to the reference group (85–90/80–85 of WC), but not the normal or IFG groups (Table 5).

DISCUSSION

The present study demonstrated that low WC prior to PCI was associated with a higher risk of ESRD during a 5.4-year follow-up period after PCI. Moreover, this phenomenon was more obvious in the DM group than in the non-DM group. This association persisted after multivariable adjustment for important potential confounders.
Generally, BMI, an internationally accepted standard anthropomorphic measurement, is used to define obesity in research settings [17]. Several studies have examined the association between BMI and future risk of ESRD. Although the results are conflicting, most epidemiologic studies showed that a higher BMI was associated with an increased risk of kidney disease. Two large epidemiologic studies in the United States reported a positive association between BMI and ESRD, and these studies analyzed a broad spectrum of BMI among a large, diverse sample of participants with long-term follow-up for ESRD [7,8]. It is presumed that a higher BMI is an independent risk factor for ESRD in any ethnic group.
However, the association between BMI with future risk for ESRD tends to be discordant in patients with renal impairment, and this population thus exhibits a so-called “obesity paradox.” Specifically, although a high BMI is associated with all-cause mortality and decreased renal function in patients with earlier stages of CKD, this association is attenuated in patients with advanced CKD [18,19]. In addition, a few studies also showed that patients with obesity paradoxically exhibited more favorable clinical outcomes with respect to in-hospital, short-, and long-term mortality than those without obesity after PCI [2023]. Therefore, there are still controversies between BMI and the risk for future ESRD in PCI patients. We therefore considered that longitudinal studies are required to explore the actual relationship between BMI and the risk of ESRD. To the best our knowledge, this is the first nationwide cohort study that examines the relationship between lower BMI and ESRD risk in the Korean population prior to PCI. Our findings were inconsistent with most previous published studies, showing that BMI prior to PCI was not associated with risk for ESRD.
Recently, measures of central or abdominal obesity, defined by the WC and waist-hip ratio, have been used as more important predictors to assess the mortality risk than BMI [24,25]. WC, a representative marker of visceral body fat, was found to correlate with inflammation, whereas subcutaneous body fat may be an indicator of the nutritional status [26]. In patients with ESRD, multiple studies identified WC as a direct and strong predictor of mortality and incident cardiovascular events, even after adjusting for the BMI and other risk factors [27,28]. In fact, many studies have shown that central obesity or abdominal adiposity measured by the WC was linearly associated with a higher risk of mortality after PCI [29]. However, our findings show that a WC under < −80/< −75 cm showed the highest risk for future ESRD development as well as higher mortality. Increasing WC was also linearly associated with a lower risk of future ESRD development. However, unlike BMI, low WC prior to PCI was a risk for ESRD, especially in the DM group, suggesting that WC maybe more accurate than BMI to estimate the risk for ESRD in prior to PCI. In our study, there was tendency of a WC of ≥ 100/≥ 95 cm (men/women) to increase the risk of ESRD in the DM and non-DM groups. More research on central obesity as a risk factor is needed.
The exact mechanisms by which a low WC presents a high risk for ESRD development in PCI patients are not known. High adiposity itself has been reported as a predictor of good prognosis among patients with coronary artery disease. Lavie et al. [30] reported that a high percentage of body fat, which was measured using the sum of the skinfold method, was associated with a low mortality rate among patients with stable angina. However, more systematic studies are needed to confirm this hypothesis.
Our study has several limitations. First, we did not collect relevant information on the food habits or other comorbidities that might affect weight. Second, this study did not consider use of medications such as hypoglycemic agents or lipid lowing agents, and adherence to treatment. Third, we were unable to obtain more information about the causes of ESRD. Fourth, we used data from the NHIS checkup program in a Korean population; therefore, we cannot generalize the results to other ethnic groups. Fifth, although we monitored the subjects for 5.4 years, the time of follow-up is short for patients to develop ESRD. Sixth, because of the nature of the claim data, we were unable to evaluate the indication or purpose of the PCI.
In conclusion, to the best of our knowledge, this is the first study on the relationship between BMI and WC prior to PCI and ESRD development in a large general population using a well-established and validated longitudinal national database for around 5.4 years. Our study demonstrated that low WC prior to PCI, which showed the increased ESRD risk in patients undergoing PCI, especially in those with DM.

KEY MESSAGE

1. This is the first study on the relationship between body mass index (BMI) and waist circumference (WC) prior to percutaneous coronary intervention (PCI) and end-stage renal disease (ESRD) development.
2. The BMI prior to PCI was not a risk factor for ESRD with or without diabetes mellitus (DM).
3. Low WC prior to PCI showed an increased ESRD risk in patients undergoing PCI, especially in those with DM.

Supplementary Information

Conflict of Interest

No potential conflict of interest relevant to this article was reported.

Acknowledgments

This research was supported by a grant (BCRI21046, BCRI20025, BCRI20076) of Chonnam National University Hospital Biomedical Research Institute.

Figure 1
Flow diagram of the study. PCI, percutaneous coronary intervention; NHI, National Health Insurance; BMI, body mass index; WC, waist circumference; ESRD, end-stage renal disease.
kjim-2021-313f1.jpg
Figure 2
Incidence rates, hazard ratios, and 95% confidence intervals (CIs) of end-stage renal disease by (A) body mass index and (B) waist circumference. Adjusted for age, sex, income-low 25%, diabetes mellitus, hypertension, dyslipidemia, current smoker, alcohol consumption, regular exercise, and estimated glomerular filtration rate.
kjim-2021-313f2.jpg
Figure 3
Cubic spline curves depicting the relationship between body mass index or waist circumference and end-stage renal disease risk in (A, C) diabetes mellitus (DM), and (B, D) non-DM subgroup. Adjusted for age, sex, income, DM, dyslipidemia, hypertension, smoking, alcohol drinking, physical activity, and estimated glomerular filtration rate. HR, hazard ratio; CI, confidence interval.
kjim-2021-313f3.jpg
kjim-2021-313f4.jpg
Table 1
Baseline characteristics of participants by level of body mass index
Variable Distribution of BMI, kg/m2 p value
< 18.5 (n = 2,158) 18.5–23 (n = 37,438) 23–25 (n = 38,381) 25–30 (n = 55,848) > 30 (n = 6,339)
Age, yr 70.41 ± 10.29 65.66 ± 10.34 63.63 ± 10.17 61.97 ± 10.50 59.22 ± 12.06 < 0.0001
Male sex 1,451 (67.24) 26,075 (69.65) 27,869 (72.61) 40,061 (71.73) 3,892 (61.4) < 0.0001
Smoking < 0.0001
 None 964 (44.67) 17,835 (47.64) 18,202 (47.42) 26,619 (47.66) 3,280 (51.74)
 Ex- 359 (16.64) 7,580 (20.25) 9,044 (23.56) 13,411 (24.01) 1,157 (18.25)
 Current 835 (38.69) 12,023 (32.11) 11,135 (29.01) 15,818 (28.32) 1,902 (30)
Drinking < 0.0001
 None 1,563 (72.43) 24,789 (66.21) 24,162 (62.95) 34,628 (62) 4,168 (65.75)
 Mild 468 (21.69) 10,413 (27.81) 11,883 (30.96) 17,347 (31.06) 1,709 (26.96)
 Heavy 127 (5.89) 2,236 (5.97) 2,336 (6.09) 3,873 (6.93) 462 (7.29)
Regular exercise 281 (13.02) 7,284 (19.46) 8,370 (21.81) 11,695 (20.94) 1,111 (17.53) < 0.0001
Incomea 546 (25.3) 8,295 (22.16) 8,250 (21.5) 11,883 (21.28) 1,424 (22.46) < 0.0001
DM 513 (23.77) 11,254 (30.06) 12,264 (31.95) 18,979 (33.98) 2,630 (41.49) < 0.0001
HTN 515 (23.86) 9,342 (24.95) 10,416 (27.14) 17,636 (31.58) 2,593 (40.91) < 0.0001
CVD 491 (22.75) 7,705 (20.58) 7,710 (20.09) 11,075 (19.83) 1,352 (21.33) 0.0002
Heart failure 250 (11.58) 3,199 (8.54) 3,165 (8.25) 4,852 (8.69) 772 (12.18) < 0.0001
Cancer 137 (6.35) 1,738 (4.64) 1,430 (3.73) 1,779 (3.19) 180 (2.84) < 0.0001
Dyslipidemia 863 (39.99) 17,527 (46.82) 19,405 (50.56) 30,177 (54.03) 3,812 (60.14) < 0.0001
CKD (eGFR < 60 mL/min/1.73 m2) 343 (15.89) 5,606 (14.97) 5,644 (14.71) 8,527 (15.27) 1,101 (17.37) < 0.0001
15 ≤ eGFR < 30 mL/min/1.73 m2 17 (0.79) 332 (0.89) 248 (0.65) 380 (0.68) 61 (0.96) 0.0002
eGFR < 15 mL/min/1.73 m2 18 (0.83) 296 (0.79) 293 (0.76) 385 (0.69) 60 (0.95) 0.1272
Weight, kg 44.76 ± 5.85 56.18 ± 6.97 63.58 ± 6.92 71.2 ± 8.54 83.67 ± 11.56 < 0.0001
Height, cm 159.97 ± 9.39 161.65 ± 8.88 162.63 ± 8.71 162.85 ± 9.08 161.9 ± 10.21 < 0.0001
WC, cm 70.48 ± 6.32 78.78 ± 5.84 84.15 ± 5.25 89.65 ± 5.93 98.89 ± 7.31 < 0.0001
BMI, kg/m2 17.42 ± 0.94 21.43 ± 1.14 23.96 ± 0.57 26.77 ± 1.29 31.8 ± 1.92 < 0.0001
SBP, mmHg 126.2 ± 18.15 128.13 ± 16.43 129.72 ± 15.76 131.55 ± 15.56 134.97 ± 16.29 < 0.0001
DBP, mmHg 76.27 ± 11.39 77.45 ± 10.28 78.65 ± 10.1 80.13 ± 10.22 82.58 ± 11.09 < 0.0001
Glucose, mg/dL 108.75 ± 48.03 110.81 ± 40.57 111.96 ± 38.22 113.44 ± 37.2 119.25 ± 41.15 < 0.0001
TC, mg/dL 195.07 ± 42.04 201.89 ± 45.56 205.07 ± 44.36 207.25 ± 47.38 211.09 ± 53.45 < 0.0001
HDL, mg/dL 55.16 ± 15.07 51.77 ± 23.21 49.24 ± 18.74 48.16 ± 23.68 47.83 ± 20.99 < 0.0001
LDL, mg/dL 116.46 ± 36.95 123.1 ± 51.12 125.31 ± 70.69 125.38 ± 66.65 126.07 ± 57.03 < 0.0001
TG, mg/dLb 103.54 (101.51–105.62) 123.97 (123.33–124.61) 139.77 (139.05–140.5) 154.47 (153.81–155.14) 170.72 (168.54–172.92) < 0.0001
eGFR, mL/min/1.73 m2 82.38 ± 33.54 82.26 ± 40.94 81.2 ± 40.88 80.55 ± 41.04 80.46 ± 42.62 < 0.0001
Hemoglobin, g/dL 13.11 ± 1.69 13.78 ± 1.65 14.16 ± 1.6 14.38 ± 1.61 14.45 ± 1.72 < 0.0001
Death 768 (35.59) 6,108 (16.31) 4,075 (10.62) 4,763 (8.53) 480 (7.57) < 0.0001

Values are presented as mean ± standard deviation, number (%), or median (range).

BMI, body mass index; DM, diabetes mellitus; HTN, hypertension; CVD, cardiovascular disease; CKD, chronic kidney disease; eGFR, estimated glomerular filtration rate; WC, waist circumference; SBP, systolic blood pressure; DBP, diastolic blood pressure; TC, total cholesterol; HDL, high density lipid; LDL, low density lipoprotein; TG, triglyceride.

a Low income 25%.

b Geometric mean.

Table 2
Baseline characteristics of participants by level of waist circumference
Variable Distribution of WC, cm p value
< 80/< 75 (n = 22,619) 80–85/75–80 (n = 31,637) 85–90/80–85 (n = 36,739) 90–95/85–90 (n = 27,108) 95–100/90–95 (n = 214,049) ≥ 100/≥ 95 (n = 8,012)
Age 63.95 ± 11.04 62.79 ± 10.45 63.14 ± 10.42 63.50 ± 10.43 64.09 ± 10.70 64.22 ± 11.24 < 0.0001
Male sex 16,240 (71.8) 23,800 (75.23) 26,479 (72.07) 19,216 (70.89) 9,065 (64.52) 4,548 (56.76) < 0.0001
Smoking < 0.0001
 None 10,461 (46.25) 14,116 (44.62) 17,527 (47.71) 12,932 (47.71) 7,339 (52.24) 4,525 (56.48)
 Ex- 4,425 (19.56) 7,285 (23.03) 8,552 (23.28) 6,606 (24.37) 3,106 (22.11) 1,577 (19.68)
 Current 7,733 (34.19) 10,236 (32.35) 10,660 (29.02) 7,570 (27.93) 3,604 (25.65) 1,910 (23.84)
Drinking < 0.0001
 None 14,698 (64.98) 19,388 (61.28) 23,061 (62.77) 17,130 (63.19) 9,379 (66.76) 5,654 (70.57)
 Mild 6,593 (29.15) 10,234 (32.35) 11,315 (30.8) 8,116 (29.94) 3,699 (26.33) 1,863 (23.25)
 Heavy 1,328 (5.87) 2,015 (6.37) 2,363 (6.43) 1,862 (6.87) 971 (6.91) 495 (6.18)
Regular exercise 4,611 (20.39) 6,957 (21.99) 7,768 (21.14) 5,488 (20.24) 2,622 (18.66) 1,295 (16.16) < 0.0001
Incomea 5,100 (22.55) 6,810 (21.53) 7,878 (21.44) 5,731 (21.14) 3,064 (21.81) 1,815 (22.65) < 0.0001
DM 5,539 (24.49) 9,148 (28.92) 11,772 (32.04) 9,727 (35.88) 5,643 (40.17) 3,811 (47.57) < 0.0001
HTN 5,183 (22.91) 8,223 (25.99) 10,482 (28.53) 8,478 (31.27) 4,925 (35.06) 3,211 (40.08) < 0.0001
CVD 4,218 (18.65) 5,628 (17.79) 7,300 (19.87) 5,755 (21.23) 3,323 (23.65) 2,109 (26.32) < 0.0001
Heart failure 1,677 (7.41) 2,346 (7.42) 3,050 (8.3) 2,460 (9.07) 1,581 (11.25) 1,124 (14.03) < 0.0001
Cancer 1,049 (4.64) 1,165 (3.68) 134 (3.66) 946 (3.49) 475 (3.38) 284 (3.54) < 0.0001
Dyslipidemia 10,036 (44.37) 15,205 (48.06) 18,954 (51.59) 14,696 (54.21) 8,124 (57.83) 4,769 (59.52) < 0.0001
CKD (eGFR < 60 mL/min/1.73 m2 2,796 (12.36) 4,110 (12.99) 5,338 (14.53) 4,473 (16.5) 2,716 (19.33) 1,788 (22.32) < 0.0001
15 ≤ eGFR < 30 mL/min/1.73 m2 171 (0.76) 221 (0.7) 214 (0.58) 201 (0.74) 122 (0.87) 109 (1.36) < 0.0001
eGFR < 15 mL/min/1.73 m2 143 (0.63) 249 (0.79) 279 (0.76) 194 (0.72) 116 (0.83) 71 (0.89) 0.1383
Weight, kg 55.1 ± 7.86 61.6 ± 7.9 65.51 ± 8.58 69.67 ± 9.3 72.94 ± 10.47 78.84 ± 12.83 < 0.0001
Height, cm 160.65 ± 8.51 162.39 ± 8.48 162.69 ± 8.89 163.26 ± 9.2 162.75 ± 9.76 162.26 ± 10.19 < 0.0001
WC, cm 73.82 ± 4.26 80.86 ± 2.59 85.54 ± 2.66 90.29 ± 2.63 94.86 ± 2.77 101.64 ± 4.84 < 0.0001
BMI 21.29 ± 2.08 23.3 ± 1.84 24.68 ± 1.91 26.06 ± 2 27.43 ± 2.19 29.81 ± 2.97 < 0.0001
SBP, mmHg 127.11 ± 16.38 129.04 ± 15.77 130.28 ± 15.61 131.48 ± 15.78 132.74 ± 16.02 134.5 ± 16.65 < 0.0001
DBP, mmHg 77.33 ± 10.39 78.54 ± 10.15 79.14 ± 10.19 79.75 ± 10.24 80.25 ± 10.51 81.2 ± 11.05 < 0.0001
Glucose, mg/dL 107.95 ± 39.05 110.63 ± 37.86 112.27 ± 37.95 114.09 ± 37.53 116.73 ± 40.34 121.38 ± 44.48 < 0.0001
TC, mg/dL 201.31 ± 43.9 204.93 ± 46.96 206.13 ± 44.04 206.52 ± 47.9 206.47 ± 45.42 206.43 ± 56.28 < 0.0001
HDL, mg/dL 52.89 ± 21.07 49.96 ± 20.62 48.88 ± 20.61 48.26 ± 26.72 47.94 ± 19.86 48.14 ± 23.04 < 0.0001
LDL, mg/dL 122.81 ± 46.42 125.23 ± 50.17 125.79 ± 88.22 124.89 ± 55.73 123.99 ± 51.77 122.61 ± 56.17 < 0.0001
TG, mg/dLb 115.58 (114.82–116.36) 134.29 (133.52–135.06) 145.47 (144.7–146.25) 154.47 (153.52–155.43) 159.17 (157.84–160.52) 164.02 (162.24–165.83) < 0.0001
eGFR, mL/min/1.73 m2 83.91 ± 42.09 82.22 ± 38.07 81.42 ± 45.09 79.9 ± 38.77 78.57 ± 38.59 77.65 ± 39.06 < 0.0001
Hemoglobin, g/dL 13.8 ± 1.65 14.16 ± 1.61 14.22 ± 1.63 14.28 ± 1.63 14.21 ± 1.68 14.1 ± 1.74 < 0.0001
Death 3,423 (15.13) 3,572 (11.29) 3,793 (10.32) 2,818 (10.4) 1,568 (11.16) 1,020 (12.73) < 0.0001

Values are presented as mean ± standard deviation, number (%), or median (range).

WC, waist circumference; DM, diabetes mellitus; HTN, hypertension; CVD, cardiovascular disease; CKD, chronic kidney disease; eGFR, estimated glomerular filtration rate; BMI, body mass index; SBP, systolic blood pressure; DBP, diastolic blood pressure; TC, total cholesterol; HDL, high density lipid; LDL, low density lipoprotein; TG, triglyceride.

a Low income 25%.

b Geometric mean.

Table 3
Multivariate cox analysis for incident ESRD by level of BMI and WC in underwent percutaneous coronary intervention patients
Group Total no. No. of ESRD Duration, PY IR,/1,000 PY HR (95% CI)
Model 1 Model 2 Model 3 Model 4
BMI
 < 18.5 2,158 37 9,899.1 3.74 1.136 (0.815–1.582) 1.336 (0.958–1.861) 1.331 (0.955–1.856) 1.347 (0.966–1.878)
 18.5–23 37,438 633 197,473.99 3.21 1 (ref) 1 (ref) 1 (ref) 1 (ref)
 23–25 38,381 565 211,034.25 2.68 0.842 (0.752–0.943) 0.765 (0.682–0.857) 0.754 (0.672–0.845) 0.800 (0.714–0.896)
 25–30 55,848 729 311,221.44 2.34 0.738 (0.664–0.821) 0.610 (0.547–0.679) 0.604 (0.542–0.673) 0.627 (0.562–0.698)
 > 30 6,339 118 34,578.16 3.41 1.070 (0.879–1.302) 0.746 (0.611–0.911) 0.618 (0.506–0.755) 0.641 (0.525–0.783)
p for trend < 0.0001 < 0.0001 < 0.0001 < 0.0001 < 0.0001
WC
 < 80/< 75 22,619 323 119,092.41 2.71 1.136 (0.986–1.308) 1.502 (1.304–1.731) 1.589 (1.379–1.831) 1.532 (1.330–1.766)
 80–85/75–80 31,637 442 172,675.72 2.56 1.08 (0.949–1.229) 1.230 (1.081–1.400) 1.215 (1.067–1.383) 1.176 (1.033–1.338)
 85–90/80–85 36,739 479 202,452.23 2.37 1 (ref) 1 (ref) 1 (ref) 1 (ref)
 90–95/85–90 27,108 400 150,018.41 2.67 1.128 (0.988–1.288) 1.011 (0.885–1.154) 0.938 (0.821–1.072) 0.960 (0.840–1.096)
 98–100/90–95 14,049 237 77,138.12 3.07 1.297 (1.110–1.516) 1.031 (0.882–1.205) 0.915 (0.783–1.070) 0.913 (0.781–1.067)
 ≥ 100/≥ 95 8,012 201 42,830.04 4.69 1.97 (1.671–2.323) 1.357 (1.150–1.601) 1.103 (0.934–1.302) 1.081 (0.915–1.277)
p for trend < 0.0001 < 0.0001 < 0.0001 < 0.0001 < 0.0001

Model 1: crude model; Model 2: adjusted for age, sex, income, diabetes mellitus, dyslipidemia, hypertension; Model 3: adjusted for Model 2 plus smoking, alcohol drinking, regular exercise, glomerular filtration rate; Model 4: adjusted for Model 3 plus previous cardiovascular disease, heart failure, cancer.

ESRD, end-stage renal disease; BMI, body mass index; WC, waist circumference; PY, person-years; IR, incidence rate; HR, hazard ratio; CI, confidence interval.

Table 4
Multivariate Cox analysis for incident ESRD by level of BMI in underwent percutaneous coronary intervention patients (subgroup analysis for DM)
Group BMI group Total no. No. of ESRD Duration, PY IR,/1,000 PY HR (95% CI)
Model 1 Model 2 Model 3
Normal < 18.5 1,184 13 5,571.95 2.3331 1.944 (1.095–3.452) 1.636 (0.918–2.916) 1.642 (0.922–2.927)
18.5–23 17,675 113 95,838.72 1.1791 1 (ref) 1 (ref) 1 (ref)
23–25 16,446 82 92,519.63 0.8863 0.754 (0.568–1.003) 0.785 (0.589–1.047) 0.796 (0.597–1.061)
25–30 21,698 112 123,647.66 0.9058 0.772 (0.595–1.003) 0.794 (0.608–1.038) 0.846 (0.648–1.105)
> 30 1,936 13 10,808.38 1.2028 1.025 (0.577–1.820) 0.89 (0.496–1.597) 0.983 (0.548–1.761)
IFG < 18.5 461 6 2,100.27 2.8568 2.078 (0.898–4.806) 1.977 (0.848–4.611) 1.883 (0.803–4.416)
18.5–23 8,509 61 45,194.58 1.3497 1 (ref) 1 (ref) 1 (ref)
23–25 9,671 51 53,667.81 0.9503 0.709 (0.489–1.028) 0.812 (0.557–1.184) 0.869 (0.596–1.267)
25–30 15,171 56 85,116.8 0.6579 0.492 (0.342–0.707) 0.615 (0.423–0.894) 0.640 (0.440–0.931)
> 30 1,773 13 9,686.64 1.3421 0.996 (0.548–1.813) 1.356 (0.731–2.515) 1.457 (0.782–2.713)
DM < 5 years < 18.5 180 3 816.72 3.6732 0.850 (0.269–2.685) 0.891 (0.281–2.824) 0.855 (0.269–2.713)
18.5–23 4,135 91 21,667.89 4.1998 1 (ref) 1 (ref) 1 (ref)
23–25 5,244 84 28,794.88 2.9172 0.700 (0.520–0.942) 0.634 (0.470–0.856) 0.651 (0.483–0.879)
25–30 8,925 95 50,123.92 1.8953 0.456 (0.342–0.609) 0.385 (0.286–0.518) 0.399 (0.297–0.538)
> 30 1,364 13 7,634.05 1.7029 0.410 (0.229–0.733) 0.271 (0.150–0.493) 0.282 (0.155–0.513)
DM ≥ 5 years < 18.5 333 15 1,410.16 10.6371 0.971 (0.579–1.627) 0.939 (0.559–1.575) 1.047 (0.624–1.756)
18.5–23 7,119 368 34,772.81 10.583 1 (ref) 1 (ref) 1 (ref)
23–25 7,020 348 36,051.93 9.6527 0.920 (0.794–1.065) 0.838 (0.723–0.971) 0.918 (0.792–1.065)
25–30 10,054 466 52,333.06 8.9045 0.851 (0.742–0.976) 0.739 (0.644–0.848) 0.761 (0.663–0.874)
> 30 1,266 79 6,449.09 12.2498 1.164 (0.913–1.485) 0.839 (0.656–1.074) 0.871 (0.680–1.114)
p for trend 0.0031 < 0.0001 0.0004

Model 1: crude model; Model 2: adjusted for age, sex, income, diabetes mellitus, dyslipidemia, hypertension, smoking, alcohol drinking, regular exercise, glomerular filtration rate; Model 3: adjusted for Model 2 plus previous cardiovascular disease, heart failure, cancer.

ESRD, end-stage renal disease; BMI, body mass index; DM, diabetes mellitus; PY, person-years; IR, incidence rate; HR, hazard ratio; CI, confidence interval; IFG, impaired fasting glucose.

Table 5
Multivariate Cox analysis for incident ESRD by level of WC in underwent percutaneous coronary intervention patients (subgroup analysis for DM)
Group WC group Total no. No. of ESRD Duration, PY IR,/1,000 PY HR (95% CI)
Model 1 Model 2 Model 3
Normal < 80/< 75 11,889 46 59,606.12 0.77 0.912 (0.626–1.329) 1.211 (0.879–1.669) 1.142 (0.829–1.573)
80–85/75–80 14,446 46 74,122.92 0.62 0.736 (0.505–1.072) 0.813 (0.59–1.12) 0.803 (0.583–1.107)
85–90/80–85 15,430 66 78,377.69 0.84 1 (ref) 1 (ref) 1 (ref)
90–95/85–90 10,243 35 51,201.19 0.68 0.812 (0.539–1.224) 0.867 (0.621–1.211) 0.900 (0.644–1.256)
98–100/90–95 4,689 20 22,694.35 0.88 1.047 (0.635–1.726) 0.814 (0.534–1.239) 0.885 (0.581–1.346)
≥ 100/≥ 95 2,242 18 10,218.99 1.76 2.084 (1.238–3.510) 1.482 (0.961–2.285) 0.803 (0.583–1.107)
IFG < 80/< 75 5,191 22 22,482.26 0.98 1.164 (0.679–1.997) 1.321 (0.832–2.097) 1.257 (0.793–1.995)
80–85/75–80 8,043 28 33,992.97 0.82 0.986 (0.596–1.632) 1.156 (0.77–1.737) 1.128 (0.750–1.698)
85–90/80–85 9,537 33 39,475.19 0.84 1 (ref) 1 (ref) 1 (ref)
90–95/85–90 7,138 18 28,657.83 0.63 0.754 (0.424–1.338) 0.888 (0.566–1.394) 0.913 (0.581–1.433)
98–100/90–95 3,717 8 14,123.92 0.57 0.676 (0.312–1.463) 0.721 (0.408–1.276) 0.736 (0.416–1.301)
≥ 100/≥ 95 1,959 11 6,982.17 1.58 1.87 (0.945–3.701) 1.319 (0.723–2.407) 1.390 (0.762–2.537)
DM < 5 years < 80/< 75 2,225 60 19,074.79 3.15 1.717 (1.234–2.387) 2.026 (1.378,2.98) 1.996 (1.356–2.939)
80–85/75–80 3,926 89 35,726.35 2.49 1.368 (1.017–1.84) 1.499 (1.067,2.105) 1.434 (1.020–2.016)
85–90/80–85 5,143 86 47,325.53 1.82 1 (ref) 1 (ref) 1 (ref)
90–95/85–90 4,352 73 40,502.6 1.80 0.992 (0.726–1.355) 0.906 (0.629–1.306) 0.943 (0.655–1.359)
98–100/90–95 2,532 47 23,253.69 2.02 1.114 (0.781–1.590) 0.906 (0.599–1.370) 0.912 (0.602–1.382)
≥ 100/≥ 95 1,670 23 14,219.43 1.62 0.888 (0.561–1.407) 0.738 (0.441,1.234) 0.740 (0.441–1.239)
DM ≥ 5 years < 80/< 75 3,314 195 17,929.24 10.88 1.363 (1.137–1.633) 1.431 (1.187–1.726) 1.392 (1.153–1.681)
80–85/75–80 5,222 279 28,833.48 9.68 1.22 (1.035–1.437) 1.245 (1.050–1.477) 1.197 (1.009–1.420)
85–90/80–85 6,629 294 37,273.82 7.89 1 (ref) 1 (ref) 1 (ref)
90–95/85–90 5,375 274 29,656.79 9.24 1.169 (0.992–1.379) 0.948 (0.800–1.124) 0.960 (0.810–1.138)
98–100/90–95 3,111 162 17,066.15 9.50 1.201 (0.991–1.455) 1.068 (0.877–1.300) 1.043 (0.857–1.271)
≥ 100/≥ 95 2,141 149 11,409.45 13.06 1.645 (1.351–2.003) 1.141 (0.930–1.400) 1.120 (0.912–1.376)
p for trend 0.3804 0.0361 0.0086

Model 1: crude model; Model 2: adjusted for age, sex, income, diabetes mellitus, dyslipidemia, hypertension, smoking, alcohol drinking, regular exercise, glomerular filtration rate; Model 3: adjusted for Model 2 plus previous cardiovascular disease, heart failure, cancer.

ESRD, end-stage renal disease; WC, waist circumference; DM, diabetes mellitus; PY, person-years; IR, incidence rate; HR, hazard ratio; CI, confidence interval; IFG, impaired fasting glucose.

REFERENCES

1. Patterson RE, Frank LL, Kristal AR, White E. A comprehensive examination of health conditions associated with obesity in older adults. Am J Prev Med 2004;27:385–390.
crossref pmid
2. Yoon KH, Lee JH, Kim JW, et al. Epidemic obesity and type 2 diabetes in Asia. Lancet 2006;368:1681–1688.
crossref pmid
3. An R, Ji M, Zhang S. Global warming and obesity: a systematic review. Obes Rev 2018;19:150–163.
crossref pmid
4. Ramachandran A, Chamukuttan S, Shetty SA, Arun N, Susairaj P. Obesity in Asia: is it different from rest of the world. Diabetes Metab Res Rev 2012;28:Suppl 2. 47–51.
crossref pmid
5. Prospective Studies Collaboration. Whitlock G, Lewington S, et al. Body-mass index and cause-specific mortality in 900000 adults: collaborative analyses of 57 prospective studies. Lancet 2009;373:1083–1096.
crossref pmid pmc
6. Wang Y, Chen X, Song Y, Caballero B, Cheskin LJ. Association between obesity and kidney disease: a systematic review and meta-analysis. Kidney Int 2008;73:19–33.
crossref pmid
7. Hsu CY, McCulloch CE, Iribarren C, Darbinian J, Go AS. Body mass index and risk for end-stage renal disease. Ann Intern Med 2006;144:21–28.
crossref pmid
8. Fox CS, Larson MG, Leip EP, Culleton B, Wilson PW, Levy D. Predictors of new-onset kidney disease in a community-based population. JAMA 2004;291:844–850.
crossref pmid
9. Lin TY, Liu JS, Hung SC. Obesity and risk of end-stage renal disease in patients with chronic kidney disease: a cohort study. Am J Clin Nutr 2018;108:1145–1153.
crossref pmid
10. Yang HK, Han K, Kwon HS, et al. Obesity, metabolic health, and mortality in adults: a nationwide population-based study in Korea. Sci Rep 2016;6:30329.
crossref pmid pmc
11. Lee YH, Han K, Ko SH, Ko KS, Lee KU. Taskforce Team of Diabetes Fact Sheet of the Korean Diabetes Association. Data analytic process of a nationwide population-based study using National Health Information Database established by National Health Insurance Service. Diabetes Metab J 2016;40:79–82.
crossref pmid pmc
12. World Health Organization. The Asia-Pacific Perspective: Redefining Obesity and Its Treatment. Sydney (AU): Health Communications Australia, 2000.

13. Lee SY, Park HS, Kim DJ, et al. Appropriate waist circumference cutoff points for central obesity in Korean adults. Diabetes Res Clin Pract 2007;75:72–80.
crossref pmid
14. Kim ES, Jeong JS, Han K, et al. Impact of weight changes on the incidence of diabetes mellitus: a Korean nationwide cohort study. Sci Rep 2018;8:3735.
crossref pmid pmc
15. Noh J, Han KD, Ko SH, Ko KS, Park CY. Trends in the pervasiveness of type 2 diabetes, impaired fasting glucose and co-morbidities during an 8-year-follow-up of nationwide Korean population. Sci Rep 2017;7:46656.
crossref pmid pmc
16. Koo DH, Han KD, Park CY. The incremental risk of pancreatic cancer according to fasting glucose levels: nationwide population-based cohort study. J Clin Endocrinol Metab 2019;104:4594–4599.
crossref pmid
17. Engin A. The definition and prevalence of obesity and metabolic syndrome. Adv Exp Med Biol 2017;960:1–17.
crossref pmid
18. Ahmadi SF, Zahmatkesh G, Ahmadi E, et al. Association of body mass index with clinical outcomes in non-dialysis-dependent chronic kidney disease: a systematic review and meta-analysis. Cardiorenal Med 2015;6:37–49.
crossref pmid pmc
19. Lu JL, Kalantar-Zadeh K, Ma JZ, Quarles LD, Kovesdy CP. Association of body mass index with outcomes in patients with CKD. J Am Soc Nephrol 2014;25:2088–2096.
crossref pmid pmc
20. Dhoot J, Tariq S, Erande A, Amin A, Patel P, Malik S. Effect of morbid obesity on in-hospital mortality and coronary revascularization outcomes after acute myocardial infarction in the United States. Am J Cardiol 2013;111:1104–1110.
crossref pmid
21. Ellis SG, Elliott J, Horrigan M, Raymond RE, Howell G. Low-normal or excessive body mass index: newly identified and powerful risk factors for death and other complications with percutaneous coronary intervention. Am J Cardiol 1996;78:642–646.
crossref pmid
22. Gruberg L, Weissman NJ, Waksman R, et al. The impact of obesity on the short-term and long-term outcomes after percutaneous coronary intervention: the obesity paradox? J Am Coll Cardiol 2002;39:578–584.
crossref pmid
23. Oreopoulos A, Padwal R, Norris CM, Mullen JC, Pretorius V, Kalantar-Zadeh K. Effect of obesity on short- and long-term mortality postcoronary revascularization: a meta-analysis. Obesity (Silver Spring) 2008;16:442–450.
crossref pmid
24. Kim YH, Kim SM, Han KD, et al. Waist circumference and all-cause mortality independent of body mass index in Korean population from the National Health Insurance health checkup 2009–2015. J Clin Med 2019;8:72.
crossref pmc
25. Kittiskulnam P, Johansen KL. The obesity paradox: a further consideration in dialysis patients. Semin Dial 2019;32:485–489.
crossref pmid pmc
26. Delgado C, Chertow GM, Kaysen GA, et al. Associations of body mass index and body fat with markers of inflammation and nutrition among patients receiving hemodialysis. Am J Kidney Dis 2017;70:817–825.
crossref pmid
27. Postorino M, Marino C, Tripepi G, Zoccali C. CREDIT (Calabria Registry of Dialysis and Transplantation) Working Group. Abdominal obesity and all-cause and cardiovascular mortality in end-stage renal disease. J Am Coll Cardiol 2009;53:1265–1272.
crossref pmid
28. Postorino M, Marino C, Tripepi G, Zoccali C. CREDIT Working Group. Abdominal obesity modifies the risk of hypertriglyceridemia for all-cause and cardiovascular mortality in hemodialysis patients. Kidney Int 2011;79:765–772.
crossref pmid
29. Coutinho T, Goel K, Correa de Sa D, et al. Central obesity and survival in subjects with coronary artery disease: a systematic review of the literature and collaborative analysis with individual subject data. J Am Coll Cardiol 2011;57:1877–1886.
pmid
30. Lavie CJ, De Schutter A, Patel DA, Romero-Corral A, Artham SM, Milani RV. Body composition and survival in stable coronary heart disease: impact of lean mass index and body fat in the “obesity paradox”. J Am Coll Cardiol 2012;60:1374–1380.
pmid

Editorial Office
101-2501, Lotte Castle President, 109 Mapo-daero, Mapo-gu, Seoul 04146, Korea
Tel: +82-2-2271-6792    Fax: +82-2-790-0993    E-mail: kaim@kams.or.kr                

Copyright © 2024 by Korean Association of Internal Medicine.

Close layer
prev next