


INTRODUCTION
Since the advent of percutaneous coronary balloon angioplasty, concerns regarding restenosis of the revascularised vessel have been raised. Although introduction of drug-eluting stents (DESs) has markedly reduced the rate of restenosis and the subsequent need for repeat revascularisation due to neointimal hyperplasia [1-4], late and very late thrombosis due to persistent exposure of the stent strut on the vessel wall and subsequent platelet activation at the peri-stent area have raised concerns about the widespread use of DES [5]. There is a certain degree of strut malapposition in cases of DES with long-term follow-up because constant platelet activation on the exposed strut hinders neointimal proliferation [6]. Meanwhile, bare metal stents (BMSs) are accompanied by a lower incidence of strut malapposition than DES, as it allows moderate neointimal growth [7].
Furthermore, there are various situations when longterm dual anti-platelet therapy (DAPT) is challenging, as in cases at high risk for bleeding or surgery within 6 months. Considering the late complications of DES and its compulsory administration of dual anti-platelet drugs over extended periods of time, alternative treatment options are needed.
Promising clinical data have been reported for standalone use of the drug-eluting balloon (DEB), especially in cases with bifurcation lesions and small vessel coronary disease [8-10]. Furthermore, the improved clinical outcomes of BMS with a revised stent design and reduced strut thickness have also been shown [11,12]. Despite these advances, clinical trials failed to prove the non-inferiority of combined treatment with DEB and the thinner BMS compared to DES [13,14].
Accordingly, we investigated whether the strategy of DEB + BMS showed better strut coverage than DES and why DEB + BMS demonstrated inferior outcomes to DES. We retrospectively analysed optical coherence tomography (OCT) or intravascular ultrasonography (IVUS) images after the index procedure and 9 months after percutaneous coronary intervention using patients from our previous study [14]. From this study, we intended to identify the factors that influenced the inferior outcomes of DEB + BMS.
METHODS
Study design
This was a retrospective, post hoc analysis of a randomised, open-label trial to compare stent restenosis between a paclitaxel-coated balloon (Sequent Please, B. Braun, Melsungen, Germany) followed by BMS implantation (Coroflex Blue, B. Braun) to placement of a zotarolimus-eluting stent (ZES) (Resolute Integrit, Medtronic, Minneapolis, MN, USA) in de novo coronary lesions [14].
Patient population
The records of patients who had participated in our previous study [14] were retrospectively reviewed. The previous study included patients with stable angina or non-ST elevation acute coronary syndrome due to significant de novo coronary stenosis. If IVUS or OCT was performed after the index procedure and at the 9-month follow-up coronary angiography (CAG), the patient was included in the analysis. There were 90 patients in each treatment group. We obtained baseline and follow-up OCT data of eight patients and IVUS data of 20 patients from each group. We analysed various imaging parameters including lesion length, reference vessel diameter, minimal lumen diameter, and percent diameter stenosis from quantitative CAG. Neointimal thickness, lumen area, stent area, lumen area, lumen volume, volume of neointimal hyperplasia, and obstruction volume due to neointimal hyperplasia volume from OCT or IVUS data were also compared. From OCT data, the percent of strut malapposition was analysed.
Endpoints
The primary endpoint of this study was the number of malapposed struts as measured using OCT imaging at the 9-month follow-up CAG. The secondary endpoints included the obstruction volume due to neointimal hyperplasia (neointimal hyperplasia volume/stent volume, %) at the 9-month follow-up CAG. The stent volume, luminal volume, and neointimal hyperplasia volume were measured with OCT or IVUS.
Intravascular ultrasound
IVUS images were acquired from 5 mm distal to 5 mm proximal to the lesion. The guidewire was positioned distal to the lesion, and an IVUS catheter (Eagle Eye® Platinum, Philips, Amsterdam, the Netherland) was slid over the guidewire. Then, the catheter was pulled back automatically at a speed of 0.5 mm per second.
Optical coherence tomography
OCT imaging of the lesion was performed after the procedure and at the 9-month follow-up using a frequency-domain OCT system (C7-XR OCT imaging system, LightLab Imaging Inc., St. Jude Medical, St. Paul, MN, USA). A continuous, nonocclusive contrast was flushed through the guiding catheter at a rate of 4 to 5 mL/sec for 3 to 4 seconds.
Intravascular imaging analysis
All OCT and IVUS images were analysed at our laboratory by an analyst who was blinded to patient and procedural information using an automated edge detection system (CASS 5.7.1, Pie Medical Imaging Systems, Maastricht, the Netherlands). Cross-sectional images were analysed at 1-mm intervals. A strut in OCT images was defined as an embedded strut if the endoluminal strut boundary was below the level of the luminal surface [15]. An apposed strut was defined as a strut completely attached to the vessel wall without any gap between itself and the wall. A malapposed strut was defined as a strut that had detached from the vessel wall by Ōēź 110 ╬╝m (ZES) or Ōēź 65 ╬╝m (BMS). An uncovered strut was defined as having a neointimal hyperplasia (NIH) thickness of 0 ╬╝m. The percentage of uncovered or malapposed struts was calculated as the ratio of uncovered or malapposed struts to total struts in all OCT cross sections [16].
Stent and luminal cross-sectional areas (CSAs) were measured on OCT or IVUS images; NIH CSA was calculated as the stent CSA minus the luminal CSA. NIH thickness was measured as the distance between the endoluminal surface of the neointima and the strut [16].
Sample size calculation
When we first design the study, we hypothesized that the frequency of an uncovered BMS strut with DEB at 9 months would be 8%, and that of an uncovered ZES strut 16%, based on outdated reports [17-19]. Recently reported frequency of an uncovered ZES strut are 2% to 6%, lower than historical results [20-22]. Assuming a two-sided ╬▒-level of 0.05, a statistical power of 80%, and an estimated attrition rate of 10% (for 9-month angiographic follow-up), we would need a total of 452 OCT cross-sections. In our previous study, the mean stent length was 20 mm [14]. Therefore, 452 sections (452 mm) divided by 20 mm/patient results in about 22 patients.
Statistical analyses
The baseline characteristics of the studied patients were summarised in terms of frequencies and percentages for categorical variables and in terms of means with standard deviations (SDs) for continuous variables. Categorical variables were analysed using either the chi-square test or the Fisher exact test. Continuous data were compared using an unpaired Student t test, WilcoxonŌĆÖs rank-sum test or Mann-Whitney U test if test for normality was not satisfied. A p value less than 0.05 was considered statistically significant. Because we compared the intravascular imaging data of the two treatment groups using IVUS or OCT, we analysed the data using two-way analysis of variance (ANOVA).
Ethical approval
This study was approved and monitored by the Institutional Review Board of Seoul National University Bundang Hospital. If all the inclusion criteria and none of the exclusion criteria were met, the patients were asked for their written informed consent, as required by the Institutional Review Board (E-1203-072002) in accordance with the Declaration of Helsinki.
RESULTS
Patients
We obtained baseline and follow-up OCT images from 16 patients; eight in the DEB + BMS group and eight in the DES group. Baseline and follow-up IVUS images were available from 40 patients, 20 in the DEB + BMS group and 20 in the DES group. The baseline clinical characteristics of patients in the two groups were similar (Table 1).
Baseline, post-procedural, and follow-up quantitative coronary angiography data
Before the procedure, the reference vessel diameter, minimum lumen diameter, and percent diameter stenosis were not different between DEB + BMS group and DES group. The lesion length in the DES group before the procedure was significantly longer than that in the DEB + BMS group (19.18 ┬▒ 5.43 vs. 13.88 ┬▒ 3.96, p < 0.001) because we designed this study to match the DEB and DES length between both groups and inserted a shorter BMS than DEB in the DEB + BMS group. The percent diameter stenosis in patients who were evaluated using OCT was 66.06% ┬▒ 12.87%, while that in patients evaluated using IVUS was 74.92% ┬▒ 14.19% (p = 0.033). The post-procedural reference vessel diameter, minimal lumen diameter, and percent diameter stenosis were not different between the two treatment groups or the two imaging methods. At the 9-month follow-up CAG, in-segment and in-stent percent diameter stenosis was significantly higher in the DEB + BMS group than in the DES group (p = 0.039 and p = 0.034, respectively). Reference vessel diameter, minimal lumen diameter, percent diameter stenosis and eccentricity index at the 9-month follow-up were not different between the groups evaluated using OCT and IVUS (Table 2).
Optical coherence tomography & intravascular ultrasonography results at baseline and 9-month follow-up
Various quantitative variables from OCT and IVUS images were combined and analysed. Neointimal hyperplasia, represented by thickness, area, or volume, was significantly higher in the DEB + BMS group than in the DES group (Table 3). However, stent area and volume were not different between the treatment groups. Accordingly, volume obstruction was significantly higher in the DEB + BMS group (14.90% ┬▒ 15.36% vs. DES 7.03% ┬▒ 11.39%, p = 0.025).
Change of mean lumen area during the follow-up period (post-procedural mean lumen area ŌĆō mean lumen area at the 9-month follow-up) was significantly higher in the DEB + BMS group (0.83 ┬▒ 1.11 vs. DES 0.20 ┬▒ 0.81, p = 0.009). Change of minimal luminal area also revealed a similar result (0.89 ┬▒ 1.35 in the DEB + BMS group vs. 0.14 ┬▒ 0.93 in the DES group, p = 0.013). Neointimal thickness measured using OCT was significantly thicker than that of IVUS (138.26 ┬▒ 128.59 vs. 81.00 ┬▒ 87.41, p = 0.042), and neointimal hyperplasia area and volume were also numerically higher in the OCT measurement group. Change of mean lumen area, minimal lumen area, and lumen volume during the follow-up period were also higher in the OCT group than in the IVUS group (1.24 ┬▒ 1.15 vs. 0.22 ┬▒ 0.79, 1.22 ┬▒ 1.39 vs. 0.2 ┬▒ 1.01, 0.85 ┬▒ 0.08 vs. 0.89 ┬▒ 0.02, respectively; all p < 0.01) (Table 3).
Degree of calcification on coronary atherosclerotic plaque before procedure
We could obtain OCT images of 15 patients (eight from DEB + BMS group, seven from DES group) which were performed before procedure. Coronary calcification was observed in three patients from each group. There were no significant differences of presence of calcification (37.5% in DEB + BMS group vs. 42.9% in DES group, p = 0.833), maximal calcium angle (58.1 ┬▒ 815 in DEB + BMS group vs. 76.8 ┬▒ 96.8 in DES group, p = 0.695), and percent calcium length between the two groups (8.2 ┬▒ 15.1 vs. 19.2 ┬▒ 33.7, p = 0.945).
Strut apposition at post-procedure and at the 9-month follow-up
The mean number of struts analysed per 1 mm section was not different between the groups at post-procedure and at 9 months (Table 4). The mean number of malapposed struts/1 mm section was not different post-procedure between both groups either. It was decreased at 9 months in both groups. The mean number of uncovered struts was also similar between both groups.
Intra-individual heterogeneity of neointimal hyperplasia
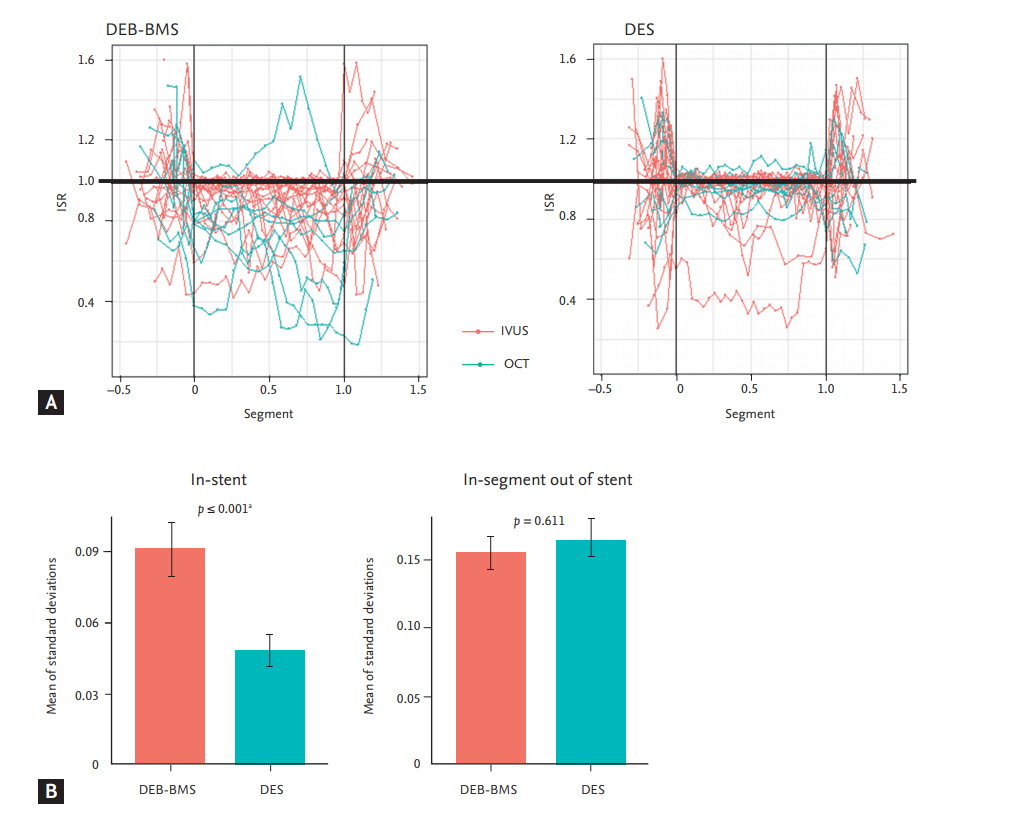
The degree of restenosis was calculated on each cross-sectional image. At the in-stent cross section, the degree of restenosis was defined as the ratio of the lumen area to the stent area. At the in-segment cross section out of the stent, the degree of restenosis was defined as the ratio of the follow-up lumen area to the post-procedural lumen area. A restenosis degree over 1.6 was considered to be an abnormal measurement was excluded from the analysis. The degree of restenosis alongside the lesion was plotted on the coordinate (Fig. 1A). On the X axis, the proximal edge of the stent was regarded as 0, and the distal edge of the stent was set to 1. The degree of restenosis was plotted on the Y axis. The lumen area of the DES was well maintained during the follow-up period, while the lumen area of the DEB + BMS group demonstrated variable and suboptimal inhibition of restenosis.
For each patient, the SD of the degree of restenosis from every cross-sectional image was calculated. As the SD of the degree of restenosis from the patients did not meet the assumption of normality, square root transformation was conducted (after transformation, Shapiro-Wilk test, p = 0.189) and then analysed using twoway ANOVA. The mean of the SD of the degree of restenosis in the stent was significantly higher in the DEB + BMS group than in the DES group (DEB + BMS 0.09 ┬▒ 0.06 vs. DES 0.05 ┬▒ 0.03, p < 0.001) (Fig. 1B). However, the mean of the SD of the degree of restenosis at in-segment out of the stent was not different between the DEB + BMS and DES groups (DEB + BMS 0.15 ┬▒ 0.06 vs. DES 0.16 ┬▒ 0.08, p < 0.001).
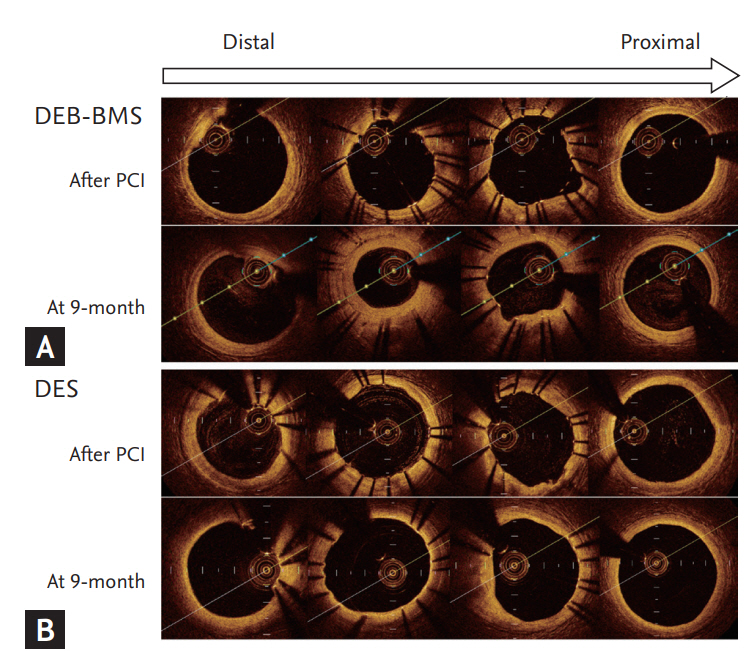
Degree of neointimal hyperplasia and OCT images from representative cases of each treatment group was presented at Fig. 2. The two patients have similar baseline clinical and angiographic parameters. The lesion which treated with DEB + BMS demonstrate significant and heterogeneous neointimal hyperplasia, while lesion treated with DES display minimal and homogeneous neointimal hyperplasia.
DISCUSSION
Concordant with numerous earlier studies, this study also demonstrated that the DEB + BMS strategy is inferior to the DES strategy. The degree of restenosis and neointimal hyperplasia were measured using intravascular imaging, and they were significantly higher in the DEB + BMS group than in the DES group. Despite the higher neointimal growth, strut malapposition in the DEB + BMS group was not less than that in the DES group. The degree of restenosis at each cross-sectional level in the DEB + BMS group demonstrated significantly higher intra-individual heterogeneity than that in the DES group.
The combination of a paclitaxel-coated balloon plus BMS was suggested because of the following possible advantages: (1) decreased neointimal proliferation due to homogenous administration of high concentration paclitaxel to the vessel wall, (2) decreased risk of stent thrombosis by facilitating a more rapid endothelialisation due to the use of a BMS compared to the use of a DES, and (3) reduced dual antiplatelet therapy, especially in patients with contraindications for prolonged DAPT [23-25]. However, DEB + BMS was inferior to DES in terms of late luminal loss for de novo coronary artery lesions in previous studies [13,14]. Myocardial infarction and stent thrombosis occurred more often in the DEB + BMS treatment group [13]. Therefore, its suggested advantages seem not to be realised in the clinical setting.
The reason for this could be explained by our results. First, drug delivery with the DEB to the vessel wall could be suboptimal and inhomogeneous, considering the high neointimal growth and intra-lesion variation in the DEB + BMS group. While a DES elutes anti-inflammatory drugs for several months, DEB drug delivery only lasts for a few days [8]. Vessel tortuosity, intraluminal irregularity and calcification could also hinder its effectiveness and hinder homogeneous drug delivery to the lesion. Second, drugs on the balloon catheter could be another problem. In studies regarding DESs, stents with paclitaxel were inferior to sirolimus-eluting stents or ZESs [3,26]. Patients treated with a paclitaxel-eluting stent had a significantly higher frequency of diffuse-intrastent in-stent restenosis (ISR) compared to a sirolimus-eluting stent ISR [27]. Therefore, paclitaxel from a DEB may not inhibit neointimal hyperplasia as effectively as the ZES.
We also found that the DEB + BMS strategy has no merit in the aspects of stent malapposition. We believe that inhomogeneity and the ISR might affect this result. Although there was high neointimal growth in one part of the lesion, there could have been excess inhibition of neointimal growth and re-endothelialisation in the other part of the lesion. In contrast, DES seems to release stable and homogeneous inhibitory drugs from polymers to the vessel walls based on the less variable ISR.
Due to various disadvantages mentioned above, BMS strategy is not a standard therapy for coronary artery disease, except for specific situations such as need of surgery which cannot be delayed over 12 months [28]. Furthermore, a promising clinical result in terms of shortened duration of DAPT from polymer-free drug coated stent was released recently [29]. Our data could explain why BMS strategy should not be used in general populations.
This study has several limitations. First, we used two different intravascular imaging modalities to evaluate vessel and neointimal hyperplasia. Because we could not obtain a sufficient number of patients from one imaging modality, IVUS and OCT data should be analysed conjointly. Although there were no significant differences in outcomes between IVUS and OCT and we analysed the data using two-way ANOVA to assess the imaging modality factor, this heterogeneity of imaging tools could hinder the reliability of the study. The small number of patients could be also a limitation.
In conclusion, the DEB + BMS strategy is inferior to DES strategy because of the higher degree of neointimal hyperplasia and restenosis. Meanwhile, the incidence of strut malapposition in the DES group was less than expected, and there was no difference between the two groups. In the DEB + BMS group, a higher level of inhomogeneity of restenosis during the follow-up period was observed. This could be due to the ineffective drug delivery from DEB to the lesion. DEB technology should be improved to obtain even drug delivery to the vessel wall and homogeneous prevention of neointimal growth comparable to contemporary DES.
The DEB + BMS strategy showed a higher degree of neointimal hyperplasia and restenosis which was inferior to DES strategy. Nevertheless, the incidence of strut malapposition in the DES group was less than expected, and there was no difference between the two groups. Importantly, a higher level of inhomogeneity of restenosis during the follow-up period was observed in the DEB + BMS group.
KEY MESSAGE
1. Treatment with drug-eluting balloon (DEB) followed by bare metal stent (BMS) is inferior to the treatment with drug-eluting stent (DES).
2. The degree of restenosis and neointimal hyperplasia were significantly higher in the DEB + BMS group than in the DES group while strut malapposition did not differ between the two groups.
3. The lumen area of the DES was well maintained during the follow-up period, while the lumen area of the DEB + BMS group demonstrated variable and suboptimal inhibition of restenosis.
4. DEB technology should be improved to obtain even drug delivery to the vessel wall and homogeneous prevention of neointimal growth comparable to contemporary DES.
 PDF Links
 PubReader
 ePub Link
 Full text via DOI
 Download Citation
 Print
Print


