


INTRODUCTION
Hepatitis C virus (HCV) is one of the most common etiologies leading to chronic liver disease worldwide. Currently, approximately 3% of the global population, 170 million people, are estimated to be infected with HCV [1]. Once infected, some patients recover after acute infection, whereas the majority progress to a chronic hepatitis state. Among patients with chronic HCV hepatitis, 5% to 20% progress to liver cirrhosis over several decades, and hepatocellular carcinoma (HCC) occurs in 1% to 5% of cirrhosis patients annually [2,3]. Therefore, active antiviral treatment is required for HCV-infected patients who have a high possibility of progression to cirrhosis [4-6].
The combination therapy of pegylated interferon-α (PEG-IFN) plus ribavirin (RBV) has long been accepted worldwide as standard therapy for chronic HCV infection [5]. In recent years, however, the development of new oral direct antiviral agents (DAAs) for HCV has changed the treatment options for individuals with HCV [7]. Nonetheless, a large number of people are still treated with the classic therapy for various reasons such as unavailable environment or insurance issue [8,9].
Sustained virologic response (SVR), representing successful HCV eradication, is not achieved in all patients who receive the combination therapy. The SVR rate achieved by the treatment is different according to HCV genotype: 40% to 50% in patients with genotype 1 and approximately 80% in those with genotype 2 or 3 [8,10,11]. Accordingly, pretreatment screening of patients is important to reduce unnecessary treatment and increase cost effectiveness.
To date, several predictors have been associated with treatment response for combination therapy with PEG-IFN plus RBV. The achievement of early virologic response (EVR) implies a high possibility of SVR [10,12,13]. In addition, diverse viral or host factors have been reported to affect the response to the conventional treatment [10,14-16]. A number of studies have been performed to find new predictors for treatment response. Insulin resistance, the main pathophysiology for metabolic syndrome, was reported to reduce the achievement of SVR in patients with chronic HCV [3,17,18]. Uric acid, which is synthesized at the last step of purine decomposition, is metabolized in the liver, and serum level tends to be elevated in patients with metabolic syndrome [19].
In this study, we investigated the efficacy and safety of combined therapy with PEG-IFN plus RBV using data from a single center. Furthermore, we addressed the potential of variable factors related with metabolic syndrome, including uric acid, as predictors for response to treatment.
METHODS
Patients
We retrospectively analyzed 74 patients who were chronically infected with HCV and received combination therapy with PEG-IFN plus RBV from December 2004 to June 2009 at Chung-Ang University Hospital in Korea. To be eligible, all patients had to be at least 18 years old and seropositive for HCV antibody and HCV RNA regardless of alanine aminotransferase (ALT) level. We excluded patients with active or history of any of the following: (1) cause of hepatocellular damage other than HCV infection (e.g., positive for serum hepatitis B surface antigen, chronic alcoholism, toxic hepatitis, or autoimmune hepatitis); (2) decompensated liver cirrhosis, defined as uncontrolled ascites, variceal bleeding, or hepatic encephalopathy; (3) severe cardiac or pulmonary comorbidities; (4) immune-mediated systemic disease; (5) malignancy other than HCC; and (6) poorly controlled psychiatric disease.
All enrolled patients were naïve to all antiviral treatments. They received 180 μg of peginterferon α-2a subcutaneously once weekly in combination with weight-based RBV daily (1,000 mg for patients with body weight < 75 kg and 1,200 mg for patients with body weight ≥ 75 kg). The treatment duration was 48 weeks for HCV genotype 1 and 24 weeks for genotype 2 or 3.
Metabolic syndrome was defined as having three or more of following traits: high body mass index (BMI, more than 25 kg/m2); high triglyceride level (TG, more than 150 mg/dL); reduced high density lipoprotein (HDL) cholesterol (less than 40 mg/dL); past medical history of hypertension; and past medical history of diabetes mellitus.
Determination of treatment efficacy
HCV genotyping was performed using the restriction fragment mass polymorphism method. Serum HCV RNA quantification was determined with the Cobas Amplicor HCV Monitor version 2.0 (Roche Diagnostics, Branchburg, NJ, USA).
The primary end point of this study was achievement of SVR, defined as undetectable HCV RNA in serum at 24 weeks after completion of antiviral therapy [20]. Secondary end points were EVR (a 2-log10 or greater drop from baseline of serum HCV RNA at 12 weeks of treatment), end-of-treatment response (ETR; seronegativity of HCV RNA at the end of 24 or 48 weeks of treatment), non-response (less than 2-log10 decrease in HCV RNA from baseline during treatment period), and relapse (HCV RNA undetectable during antiviral therapy but detectable at 24 weeks after the end of treatment).
Plasma samples for determination of HCV viral titer were collected before the start of antiviral treatment, at 12 weeks after treatment, at the end of treatment (48 weeks after treatment in genotype 1 and 24 weeks after treatment in genotype 2 or 3), and at 12 and 24 weeks after cessation of treatment. ALT, HDL, low density lipoprotein (LDL), TG, and uric acid were evaluated at every visit.
Liver stiffness was evaluated by using transient elastography (FibroScan, Echosens SA, Paris, France). The measurement was performed more than 10 times in each patient. The value was calculated with kilopascal (kPa), and the median value was adopted.
Assessment of treatment safety
Safety of combination therapy with PEG-IFN plus RBV was assessed by clinical adverse events and laboratory abnormalities during the follow-up period. We classified the severity of adverse events into four grades, mild, moderate, severe, and life-threatening, according to the modified World Health Organization grading system.
The dose of PEG-IFN was adjusted according to the severity of adverse events. When absolute neutrophil count deceased to less than 750/mm3 or platelet count was less than 50,000/mm3, dose reduction was performed. If absolute neutrophil count or platelet count declined below 500/mm3 or 20,000/mm3 respectively, the treatment would be discontinued. However, if the adverse events were resolved, we considered resumption of treatment. In the case of RBV, the dose was reduced when hemoglobin level decreased below 10 g/dL and was discontinued when it decreased below 8 g/dL. Flulike symptoms, known to be the most common adverse effect of IFN, were mostly controlled by symptomatic treatment. If life-threating adverse events arose, permanent discontinuation of the treatment was mandatory.
Statistical analysis
In present study, we conducted the entire statistical analysis as intent-to-treat setting which admit noncompliance and protocol deviations.
In the tables, continuous variables are presented as mean with standard deviation, whereas qualitative and discrete variables are expressed as absolute number and relative proportion in percentage. Statistical analysis was performed using SPSS version 19.0 (IBM Co., Armonk, NY, USA). Distributions of continuous variables were analyzed using Student t test or Mann-Whitney U test. Univariable logistic-regression analyses were used to identify predictive factors related to SVR. Subsequently, multivariable logistic regression was performed for step-wise selection. A p value less than 0.05 was considered to be statistically significant.
RESULTS
Patient baseline characteristics
A total of 74 HCV-infected patients who were treatment naïve were enrolled in this study. The demographic, virologic, and baseline clinical features of the enrolled patients are shown in Table 1. The study population consisted of 40 male and 34 female patients. The mean age of the patients was 50.4 years, and mean BMI was 23.3 kg/m2. The mean value of serum ALT was 63.9 U/L at the beginning of treatment. Mean values of uric acid, HDL, TG, and LDL, factors associated with metabolic syndrome, were 5.1, 43.4, 98.5, and 95.0 mg/dL, respectively. The number of patients diagnosed with hypertension, diabetes mellitus, and metabolic syndrome were 7, 2, and 5. Regarding the composition of HCV genotype, the number of patients with G1, G2, and G3 was 33, 39, and 2, respectively. The mean serum HCV RNA titer was 5.7 log10 IU/mL. Among 74 patients, four were diagnosed with compensated liver cirrhosis. The mean duration of treatment was 29.1 weeks, and the mean follow-up period was 89.5 weeks.
Virologic response to antiviral treatment
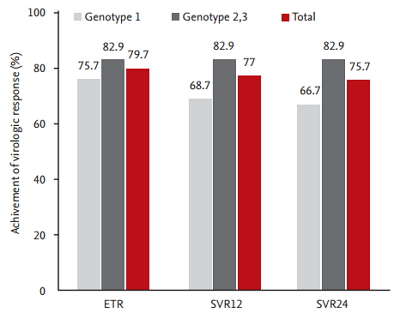
SVR was achieved in 56 of the total of 74 patients. Among 74 patients, six (three with HCV G1 and three with HCV G2/3) dropped out during the early follow-up period. Of the remaining 68 patients, 30 were HCV genotype 1, of which only four patients failed to achieve EVR. The EVR was not evaluated for 38 patients with HCV genotype 2 or 3. At the next follow-up period, three patients were withdrawn from the treatment because of severe depression and fatigue caused by the drugs. As a result, a total of 61 patients reached the treatment end point, and 59 patients had undetectable HCV viral load at this point. Of these, 56 patients that completed drug administration maintained the virologic response for the next 24 weeks after the end of treatment without relapse. There was no relapse in patients showing SVR during the further follow-up period (Fig. 1). In conclusion, the rates of ETR and SVR were 79.7% and 75.7%, respectively, in this study. The rate of SVR according to genotype was 66.7% in patients with genotype 1 and 82.9% in those with genotype 2/3 (Fig. 2).
Predictive factors for SVR achievement
To begin with, we evaluated the relationship between metabolic syndrome and uric acid level. The serum uric acid level was higher in patients with metabolic syndrome (mean 6.44 mg/dL) than patients without metabolic syndrome (mean 5.86 mg/dL) significantly (Fig. 3).
To clarify the factors that predict SVR achievement, we investigated several viral factors and host features associated with metabolic disease, including serum uric acid. First, univariate analysis was performed by comparing the clinical parameters of 56 patients with SVR and 18 patients without SVR. As shown in Table 2, baseline HCV RNA level (p = 0.012) and serum uric acid (p = 0.024) were significant predictors of SVR achievement. However, in subsequent multivariate analysis, HCV RNA level was the only independent factor associated with SVR (p = 0.030). In subgroup analysis as genotype, uric acid was also predictor of SVR in only univariate analysis of genotype 1 group (p = 0.042, data not shown), but not genotype 2/3 group. The reason for this result is that the SVR was too high in genotype 2/3 group. Although pretreatment uric acid showed potential as a predictor of SVR achievement, statistical significance was not achieved (p = 0.072).
Adverse events
Every kind of adverse event was evaluated for the total study population during the entire follow-up period (Table 3). The most frequent type of adverse event was hematologic problems. The most common adverse event was neutropenia, with an incidence of 57%, followed by anemia (32%) and thrombocytopenia (14%). In addition, a few patients suffered from itching sensation, myalgia, headache, alopecia, fatigue, and depression. Overall, 27 patients (36.5%) experienced dose reduction of RBV or PEG-IFN because of cytopenia, but no patient had to stop treatment for this reason. The SVR of total patients who have experienced dose reduction was 81.4%. There was no significance difference of SVR as compared with the patients who did not experience dose reduction.
In most cases with the subjective symptoms mentioned above, the severity of the adverse event was mild. Most of the symptoms were transient and controlled by only conservative management. However, three patients ultimately experienced discontinuation of treatment that was attributed to side effects of depression in two patients and severe fatigue in one patient (Table 4). No patient experienced a life-threatening adverse event during the treatment period.
DISCUSSION
There has been progressive improvement in SVR as the therapy for HCV infection has evolved from IFN monotherapy, through combination therapy with PEG-IFN plus RBV, to recently developed DAAs. Until comparatively recently, combination treatment with PEG-IFN and RBV has been used as standard therapy for HCV infection worldwide. However, the treatment did not show satisfactory results for all patients with HCV infection.
In this study, we evaluated the efficacy and safety of PEG-IFN plus RBV therapy and identified predictive factors of successful treatment for 74 HCV-infected patients. All statistical analyses were performed by intent-to-treat analysis. The combination treatment can affect compliance on account of long treatment duration or side effects. Accordingly, intent-to-treat analysis reflects practical clinical setting better than per-protocol analysis. The SVR rates of genotype 1 and genotype 2/3 were 66.7% and 82.9% respectively, which was marginally higher than or similar to those reported in previous studies (42% to 46% in genotype 1, 76% to 82% in genotypes 2 or 3) [10,11]. Moreover, considering that only three people in our study experienced intolerable adverse effects, the safety of this therapy was also excellent. These results may reflect the fact that all enrolled patients were East Asians, who frequently have the CC IL-28B genetic variation associated with better treatment response [15].
Combination treatment with PEG-IFN and RBV is associated with diverse adverse effects. Accordingly, selection of patients who are expected to show good treatment response is an important consideration before starting treatment. In many previous studies, viral factors including genotype, baseline viral titer, viral kinetics at specific time-points throughout the treatment, and host features including gender, age, liver fibrosis, and IL28B polymorphism were noted as predictors of treatment response [21]. In addition, insulin resistance was shown to impair SVR to the treatment in patients with chronic hepatitis C [3,17].
In this context, we investigated diverse parameters, focusing on factors related to metabolic syndrome. Although most of the previously identified predictors, such as age, gender, fibrosis, and viral genotype, were not significant in univariate analysis, uric acid (p = 0.024) and pretreatment HCV RNA titer (p = 0.012) showed potential as predictors of SVR achievement. However, only viral load maintained significance in multivariate analysis. The discrepancy between our data and previous predictors might be attributed to the insufficient number of total patients.
Nevertheless, uric acid showed better predictive value than many other variables that have been reported as predictors for treatment response. Previously, Pellicano et al. [22] reported that uric acid was a predictive factor of IFN treatment response for HCV-infected patients. Other studies have demonstrated a significant relationship between hyperuricemia and insulin resistance [23,24]. There are several possible mechanisms explaining the effects of uric acid on insulin resistance. First, intracellular lipid droplet is known to be closely associated with production of HCV particles [25]. Uric acid induces dysfunction of mitochondria, which leads to increased lipogenesis [26]. Second, uric acid-induced endoplasmic reticulum stress can cause overexpression of lipogenic enzymes [27]. Third, uric acid inhibits insulin signaling through the reactive oxygen species pathway [28]. Furthermore, given that metabolic syndrome is related to the prognosis of HCV infection [29], serum uric acid level might be an important factor to consider in the treatment of HCV infection.
In conclusion, the results of the present study suggest that metabolic syndrome represented by serum uric acid might be associated with poor treatment response to antiviral therapy for patients infected with HCV. However, the data were based on a limited number of patients in a single center. Therefore, systematically designed research including more patients is required to clarify the associations between diverse factors related with metabolic syndrome and response to HCV treatment. Though present standard treatment for chronic HCV infection is changing to DAA treatment, the investigation for association between metabolic syndrome and HCV infection may provide another base for improved outcome by the new therapy.
 PDF Links
 PubReader
 ePub Link
 Full text via DOI
 Download Citation
 Print
Print


