Korean J Intern Med > Volume 32(3); 2017 > Article
Lee, Lee, Kim, Park, Cho, Yoon, Lee, and Lee: Comparing tuberculin skin test and interferon γ release assay (T-SPOT.TB) to diagnose latent tuberculosis infection in household contacts

Abstract

Background/Aims

The tuberculin skin test (TST) and interferon γ release assay are currently used as diagnostic tools to detect latent tuberculosis (TB) infection; however, there are inconsistencies about the degree of agreement between the tests. We aimed to evaluate the concordance rate between the two tests in household contacts of a country with intermediate TB burden, where most people were vaccinated.

Methods

We recruited household contacts who spent > 8 hours daily with patients with microbiologically confirmed active pulmonary TB, and received both TST and T-SPOT.TB (Oxford Immunotec) simultaneously. The degree of agreement was analysed according to TST cutoff and Bacille Calmette-Guerin (BCG) vaccination status. Relevant factors were analysed to establish the association with TST or T-SPOT.TB.

Results

Among 298 household contacts, 122 (40.9%) were spouses, and 250 (83.9%) had received BCG vaccination. In the contact sources, 117 (39.3%) showed a positive result for acid-fast bacillus (AFB) sputum smear and 109 (36.6%) had cavities. The highest agreement rate of 69.5% and κ value of 0.378 were found with a 10 mm cutoff. Spouse, time interval from TB diagnosis to test, and AFB sputum smear positivity were significantly associated with a positive result for T-SPOT.TB. Sex, BCG vaccination, and cavity on chest computed tomography were related to TST positivity.

Conclusions

The present study suggested it was not possible for TST and T-SPOT.TB to replace each other because of considerable discrepancy between the two tests in household contacts in a country with intermediate TB prevalence.

INTRODUCTION

Subjects with latent tuberculosis infection (LTBI) are defined as those who have a positive result for the tuberculin skin test (TST) or interferon γ release assay (IGRA), but normal findings on chest X-ray without symptoms or signs of active pulmonary tuberculosis (TB) [1]. People who have made contact with patients with active pulmonary TB within 2 years are considered to be a high-risk group for progression to TB from LTBI and are recommended to undertake a TST or IGRA for chemoprophylaxis [2].
TST is conventionally performed as a standard diagnostic tool to reveal LTBI [3]. However, it has the disadvantage of a high number of false-positive results, especially in cases who have received Bacille Calmette-Guerin (BCG) vaccination, or who are infected with nontuberculous mycobacteria [4]. IGRA was recently developed to overcome the limitation of TST and is expected to be more useful [5]. Recent studies showed the superiority of IGRA to TST with regard to diagnostic specificity in subjects with BCG vaccination [5-8]. For that reason, IGRA is recommended as an alternative test to TST and is preferred for people with BCG vaccination [1,9,10]. Most of these results were reported in countries with a low prevalence of TB and with different BCG vaccination states.
Different risks of infection have been found even among close contacts, and household contacts are considered to have a closer relationship with LTBI than general close contacts [11,12]. However, few studies were conducted with homogenous household contacts only. In addition, the time interval between TST and IGRA in previous studies varied [10,13]. There is a need to perform a study in a homogeneous population using more specific criteria.
This study aimed to determine the degree of agreement between TST and IGRA when they were performed simultaneously on household contacts in a country with intermediate prevalence of TB and a high rate of BCG vaccination.

METHODS

Study population and design

The present study was conducted retrospectively in a single tertiary teaching hospital from January 2011 to December 2014. We collected all the data from a cohort of subjects with LTBI during public-private mixed project. Over a 4-year period, T-SPOT.TB (Oxford Immunotec, Abingdon, UK) was simultaneously performed with TST on close contacts. Interpreters of both tests belonged to different departments and were blinded to each other. Close contacts who were diagnosed with active pulmonary TB during the screening test, or who had last contact with active TB > 2 years ago, were not included. We enrolled only household contacts who spent > 8 hours daily together and cohabited for the last 3 months or longer with contact sources with microbiologically confirmed TB. Finally, 298 household contacts were selected for analysis.
Baseline characteristics were determined by interviewing the selected subjects and their contact sources. For the household contacts, age, sex, relationship to the contact source, time interval from the day of diagnosis of pulmonary TB to the day of screening test for LTBI, BCG vaccination, previous TB and medical history, and use of immunosuppressants were documented. The criteria of BCG vaccinated subjects were those who had a history of BCG vaccination and BCG scar. For contact sources, information on drug sensitivity, positivity of acid-fast bacillus (AFB) smear staining, cough, and pulmonary cavity were recorded. Results of AFB smear staining were reported according to the Centers for Disease Control guidelines [14]. Positivity of AFB smear was defined as ≥ 1+ of staining intensity. Cough was described by a pulmonologist if contact sources complained cough at the time of diagnosis of pulmonary TB. Cavity diagnosis was confirmed by radiology specialists with chest computed tomography (CT).

TST and T-SPOT.TB

TST and T-SPOT.TB were conducted simultaneously to exclude the booster effect of purified protein derivative (PPD) injection on IGRA [15-17]. TST was performed by intradermal injection of Tuberculin PPD RT23 SSI, 2 TU (Statens Serum Institute, Copenhagen, Denmark). Every reading of skin induration was carried out 48 to 72 hours after PPD injection in an outpatient clinic of pulmonologist. T-SPOT.TB was conducted with the TB-specific antigens early secretory antigenic target 6-kDa protein and culture filtrate protein 10. Borderline results were classified as negative because of the uncertain likelihood of TB infection [1].

Assessment of clinical outcomes

The primary objective was to reveal the rate of concordance between TST and T-SPOT.TB. We conducted subgroup analyses to clarify the effect of BCG vaccination on the rate of concordance between the two tests. Also, we analysed the associations between positivity of TST or T-SPOT.TB and several risk factors.

Statistics

Frequency and descriptive statistics analyses were used to present baseline characteristics. Binary variables were analysed with Pearson chi-square test, and ternary or quaternary variables were analysed according to linear by linear association test of trend. Univariate and adjusted multivariate analyses of risk factors for positivity of TST or T-SPOT.TB were performed according to the logistic regression model. The degree of concordance between TST and T-SPOT.TB was presented with Cohen’s κ coefficient. SPSS version 19.0 (IBM Co., Armonk, NY, USA) was used for all analyses and p < 0.05 was considered statistically significant.

Ethics

The Institutional Review Board Committee of Seoul National University Bundang Hospital approved the present retrospective study and waived the need for informed consent for the access to electric medical records (IRB No. B-1412/280-107).

RESULTS

Baseline characteristics of the study population

Among the 298 household contacts, 105 (35.2%) were male, the median age was 49, and 122 (40.9%) were spouses (Table 1). The total BCG vaccination rate was 83.9%, which was lower than expected because half of elderly people aged > 65 years had not received BCG vaccination. The mean time interval from the day of diagnosis of pulmonary TB to the day of screening test for LTBI was 32.1 days. The survey of underlying chronic diseases revealed that 19 had diabetes mellitus, 13 had cancer, seven had liver disease, and one had rheumatoid arthritis without immunosuppression. There was no household contact with chronic kidney disease, connective tissue disease, or human immunodeficiency virus infection. Among the contact sources, 117 (39.3%) showed a positive result for AFB sputum smear, and 160 (53.7%) had cough (Table 2). One hundred and nine contact sources (36.6%) had one or more cavities on chest CT.

Positivity rate of TST and T-SPOT.TB and concordance between the tests

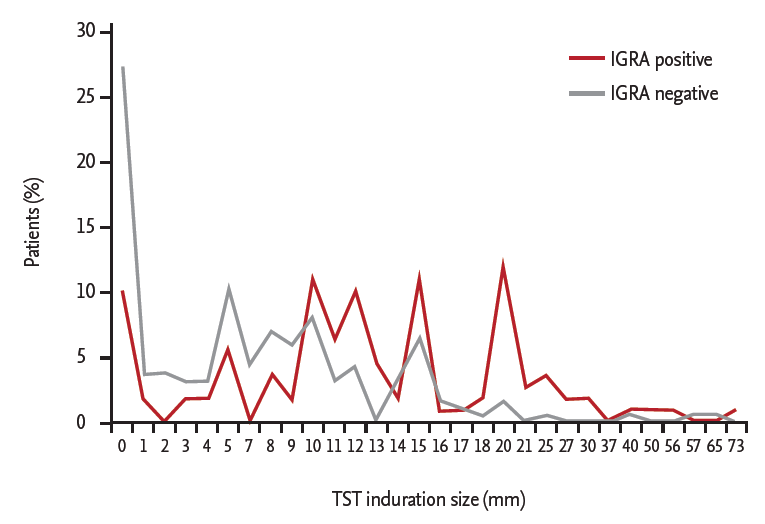
Positive results for T-SPOT.TB were found in 110 contacts (36.9%). The induration sizes of TST were classified as follows: ≥ 5 mm in 202 (67.8%), ≥ 10 mm in 139 (46.6%), and ≥ 15 mm in 69 (23.2%). Among those with positive results for T-SPOT.TB, 91 (82.7%), 79 (71.8%), and 44 (40.0%) had induration ≥ 5, ≥ 10, and ≥ 15 mm, respectively (Fig. 1). The highest positivity rate (63.8%) for T-SPOT.TB was found in the TST-positive group with a 15-mm cutoff. The analysis on the concordance rate between TST and T-SPOT.TB revealed a higher agreement rate and κ value in the TST group with a 10-mm cutoff (agreement rate 69.5% and κ = 0.378) (Table 3). The highest concordance rate was found in the contacts with TST induration ≥ 10 mm who were not vaccinated with BCG (agreement rate 72.9% and κ = 0.422, moderate agreement).

Analysis of association between TST or T-SPOT.TB and risk factors

T-SPOT.TB demonstrated a positive correlation with ageing and spouse (Table 4). Positivity of sputum AFB smear staining and time interval from the day of TB diagnosis to the day of LTBI screening test were significantly related to positivity for T-SPOT.TB. Positive results for TST were associated with male sex and BCG vaccination. The presence of chest cavities on CT was correlated with positive TST results. Cough did not have any significant association with TST or T-SPOT.TB. Adjusted multivariate analysis revealed that age, spouse, time interval from TB diagnosis to LTBI screening, and positivity of AFB smear staining were significantly related to positive T-SPOT.TB results (Tables 5 and 6). We also discovered significant positive correlations between TST results and male sex, BCG vaccination, and chest cavities on CT.

DISCUSSION

We confirmed that household contacts had a higher rate of LTBI, and lower agreement rate and κ value than overall close contacts of the similar population [11]. The highest agreement was found in the contacts without BCG vaccination and with a 10-mm cutoff for TST. While TST was associated with sex and BCG vaccination, T-SPOT.TB was related to factors, such as spouse and positivity of AFB smear which implies the degree of infectivity in the contact sources. Considering the association between positive T-SPOT.TB results and the degree of infectivity, our study suggests that T-SPOT.TB is a more accurate tool than TST for diagnosis of LTBI.
The present study had several distinctive features compared with previous studies. First, we analysed only household contacts, which was a more homogeneous population. Second, we included only contact sources with microbiologically proven, definitive TB. Third, most household contacts had prior BCG vaccination.
Several studies have revealed the factors affecting the rate of agreement between TST and IGRA. First, the degree of risk for LTBI could influence the concordance rate between the two tests. Overall agreement was 98.2% and a high concordance was reported in the low-risk population [18]. In the close contacts, however, the disagreement rate was about 10% between TST and IGRA, regardless of BCG vaccination [19,20]. Second, the agreement rates differed among the countries with different TB prevalence and BCG vaccination rates. The agreement rate in close contacts was > 80% in countries with a low prevalence of TB [21]. However, populations from countries with high TB prevalence and a high rate of BCG vaccination had a lower agreement rate of 64% with a κ value of 0.33 [13]. A study from South Korea, a country with intermediate TB prevalence and a high rate of BCG vaccination, showed an agreement rate of 70.4% and κ value of 0.39, which were around the middle of the values in high and low-prevalence countries [11]. Third, cutoff of TST could also be a factor affecting the degree of agreement. A cutoff of 10- or 15-mm showed better concordance than a 5-mm cutoff [21-23]. In the present study, we included household contacts, known high-risk factors, in a country with intermediate prevalence of TB and a high rate of BCG vaccination, and used various cutoffs of TST.
For those in close contact with active TB, TST using a 5-mm cutoff was accepted as diagnostic in North America, because being a close contact is one of the highest risk factors for LTBI and progression to active TB [2]. However, a 5-mm cutoff tended to show lower agreement with IGRA than a 10-mm cutoff [21,22,24]. Another study showed an even higher agreement rate and κ value between TST and IGRA with a 15-mm cutoff for TST in adults in a low-TB prevalence country and in children [22,23]. In the present study, a 15-mm cutoff for TST showed the same agreement rate as a 10-mm cutoff; however, the κ value was lower than for a 10-mm cutoff. The extent of disagreement was reviewed, and more false-positive results were assumed for the 10-mm cutoff, and more false-negative results for 15 mm. In countries with moderate TB prevalence, a 10-mm cutoff would be the best way to minimise missed LTBI.
BCG vaccination was related to TST positivity in adjusted multivariable analysis in the present study. Although BCG in infancy is known to have little effect on TST after 10 years of vaccination, BCG received after infancy does affect TST results [25]. The proportion of BCG vaccinations after infancy and the percentage of patients with booster vaccinations might contribute to the different degrees of concordance between the three cutoffs of TST and BCG vaccination.
Ageing influences the results of both TST and IGRA [26-28]. The present study showed that positivity for T-SPOT.TB increased with ageing. This phenomenon could be explained by accumulation of contact events with TB. In contrast, TST positivity was highest from 35 to 50 years of age and decreased with ageing, which was a similar trend to previous studies [11,22]. If booster vaccination is not given to older-age household contacts, the effect of BCG vaccination on TST may diminish as baseline interferon γ level decreases with ageing [29,30].
The present study is believed to be the first to show that being a spouse has a significant association with T-SPOT.TB positivity. Spouses are generally considered to have closer physical contact with patients than other individuals. This finding indicates the degree of intimacy between the contact and patient is as important as the duration of contact.
The indicators of infectivity from contact sources increased the positive rate of TST and T-SPOT.TB. The positivity of AFB smear staining had a strong correlation with positive T-SPOT.TB results. TST response had no relationship with smear positivity which could be explained by other confounding factors such as BCG vaccination or non-tuberculous mycobacterial infection [3]. The presence of pulmonary cavities was significantly related only to TST positivity. All the cavities were detected by chest CT, which included even tiny cavities, of which thickness and distance to airway may not influence infectivity [31]. The number of cavities without infectivity may affect the correlation between cavities and positive T-SPOT.TB results. However, it is not a complete hypothesis because we cannot explain why cavities without infectivity do not affect TST positivity. Also, cough was not associated with positive results for either test. We suggest that some patients with cough may have been missed, because their medical records depend greatly on patients’ statements and memories. This hypothesis is supported by the fact that the frequency of cough in source patients was only 53.7%, even though all of them had microbiologically confirmed pulmonary TB.
The present study has several limitations. First, it is recommended to recheck TST or IGRA in close contacts after 8 to 10 weeks when the first result is negative [1]. In this study, only a single TST and T-SPOT. TB was conducted simultaneously. The conversion rate of initial negative results is unknown. Second, we could not exclude the possibility that some close contacts had BCG vaccinations twice. For this reason, we could not clearly determine whether BCG vaccination in infancy really did not affect the results of TST in adults. Third, multivariate analysis yielded a positive association between male sex and TST results. A higher prevalence of LTBI in male subjects has been previously reported [11,21,24,32]. Although IGRA also showed significant association with sex in a recent study, it was disappeared after adjusted analysis by clinical factors including smoking status, which is concordant with the result of the present study [33]. However, smoking history was not recorded mandatorily in our study and was not available for adjustment of the association between male sex and TST results. Fourth, previous TB infection is known to affect the results of TST or IGRA. However, the present study did not show any such association, and the small number of the study population with previous TB infection could be an explanation.
In conclusion, T-SPOT.TB, but not TST, was independent of BCG vaccination but was affected by the time interval from diagnosis of TB to performance of the tests. We showed that it is not possible for T-SPOT. TB to replace TST because of the considerable discrepancy between the two tests.

KEY MESSAGE

1. Considerable discrepancy was found between the results of tuberculin skin test (TST) and T-SPOT.TB in household contacts, even in those without Bacille Calmette-Guerin (BCG) vaccination.
2. Induration sizes of ≥ 5, ≥ 10, and ≥ 15 mm were found in 67.8%, 46.6%, and 23.2% of household contacts. TST was significantly associated with sex, history of BCG vaccination, and presence of cavities on chest computed tomography in the household contacts.
3. Positive results for T-SPOT.TB were found in 36.9% of household contacts. T-SPOT.TB positivity had a significant relation with family relationship, incubation period, and sputum acid-fast bacillus smear staining in the household contacts.

Conflict of Interest

No potential conflict of interest relevant to this article was reported.

Figure 1.
Percentage of household contacts according to the induration size after tuberculin skin test (TST) subdivided by positivity of interferon γ release assay (IGRA).
kjim-2015-344f1.gif
Table 1.
Baseline characteristics of household close contacts
Characteristic Household close contacts (n = 298)
Total 298 (100)
Sex
 Male 105 (35.2)
 Female 193 (64.8)
Age, yr 49 (15–86)
 15 ≤ and < 35 73 (24.5)
 35 ≤ and < 50 78 (26.2)
 50 ≤ and < 65 88 (29.5)
 ≥ 65 59 (19.8)
Relationship
 Spouse 122 (40.9)
 Other relationshipsa 176 (59.1)
BCG vaccinationb
 Total 250 (83.9)
 15 ≤ and < 35 68 (93.2)
 35 ≤ and < 50 72 (92.3)
 50 ≤ and < 65 76 (86.4)
 ≥ 65 34 (57.6)
Time interval from TB diagnosis to LTBI screening, day 32.1 ± 45.2
 ≤ 30 201 (67.4)
 31–60 54 (18.1)
 61–120 35 (11.7)
 121–180 2 (0.7)
 > 180 6 (2)
Underlying chronic diseases, yesc 43 (14.4)
History of previous tuberculosis, yes 17 (5.7)

Values are presented as number (%), median (range), or mean ± SD.

BCG, Bacille Calmette-Guerin; TB, tuberculosis; LTBI, latent tuberculosis infection.

a There were 67 of parents, 71 of sons or daughters, 20 of siblings, and 18 of other relationships.

b BCG vaccination rate is described according to age.

c Nineteen patients had diabetes mellitus, 13 had dyslipidemia, 13 had cancer, seven had liver disease, and one had rheumatoid arthritis without immunosuppression. Some patients had multiple underlying diseases. There was no patient with chronic kidney disease, connective tissue disease, or human immunodeficiency virus infection.

Table 2.
Baseline characteristics of patients with active pulmonary tuberculosis who were household contact sources
Characteristic Contact source (n = 298)
Positivity of AFB sputum smear
 Positive 117 (39.3)
 Negative 181 (60.7)
Drug resistance
 All drug-susceptible 261 (87.6)
 Any drug-resistant 37 (12.4)
Cough, yesa 160 (53.7)
Cavity in the chest CT, yesb 109 (36.6)

Values are presented as number (%).

AFB, acid-fast bacillus; CT, computed tomography.

a Four patients were processed as missing values because of no remark on electronic medical record about symptoms.

b Three patients were processed as missing values because chest CT was not performed.

Table 3.
Agreement rate and κ value between TST and T-SPOT.TB, stratified by BCG vaccination status
Variable T-SPOT.TB
Agreement, % κ
Positive Negative
TST > 5 mm
 All study population (n = 298) 56.4 0.202
  Positive 91 (30.5) 111 (37.2)
  Negative 19 (6.4) 77 (25.8)
 Study population with BCG vaccination (n = 250) 53.6 0.170
  Positive 76 (30.4) 102 (40.8)
  Negative 14 (5.6) 58 (23.2)
 Study population without BCG vaccination (n = 48) 70.8 0.417
  Positive 15 (31.3) 9 (18.8)
  Negative 5 (10.4) 19 (39.6)
TST > 10 mm
 All study population (n = 298) 69.5 0.378
  Positive 79 (26.5) 60 (20.1)
  Negative 31 (10.4) 128 (43.0)
 Study population with BCG vaccination (n = 250) 68.8 0.375
  Positive 68 (27.2) 56 (22.4)
  Negative 22 (8.8) 104 (41.6)
 Study population without BCG vaccination (n = 48) 72.9 0.422
  Positive 11 (22.9) 4 (8.3)
  Negative 9 (18.8) 24 (50.0)
TST > 15 mm
 All study population (n = 298) 69.5 0.289
  Positive 44 (14.8) 25 (8.4)
  Negative 66 (22.1) 163 (54.7)
 Study population with BCG vaccination (n = 250) 71.6 0.344
  Positive 42 (16.8) 23 (9.2)
  Negative 48 (19.2) 137 (54.8)
 Study population without BCG vaccination (n = 48) 58.3 0.032
  Positive 2 (4.2) 2 (4.2)
  Negative 18 (37.5) 26 (54.2)

Values are presented as number (%).

TST, tuberculin skin test; BCG, Bacille Calmette-Guerin.

Table 4.
Association of variable risk factors with positivity for TST or T-SPOT.TB
Variable T-SPOT.TB
TST ≥ 5 mm
TST ≥ 10 mm
TST ≥ 15 mm
Positive Negative p value Positive Negative p value Positive Negative p value Positive Negative p value
Number (%) 110 (36.9) 188 (63.1) 202 (67.8) 96 (32.2) 139 (46.6) 159 (53.4) 69 (23.2) 229 (76.8)
Age, yr < 0.001 0.126 0.190 0.315
 15 ≤ and < 35 (n = 73, 24.5%) 9 (10.4) 64 (89.6) 48 (65.8) 25 (34.2) 31 (42.5) 42 (57.5) 14 (19.2) 59 (80.8)
 35 ≤ and < 50 (n = 78, 26.2%) 33 (42.3) 45 (57.7) 62 (79.5) 16 (20.5) 46 (59.0) 32 (41.0) 25 (32.1) 53 (67.9)
 50 ≤ and < 65 (n = 88, 29.5%) 40 (45.5) 48 (54.5) 59 (67.0) 29 (33.0) 43 (48.9) 45 (51.1) 23 (26.1) 65 (73.9)
 ≥ 65 (n = 59, 19.8%) 28 (47.5) 31 (52.5) 33 (55.9) 26 (44.1) 19 (32.2) 40 (67.8) 7 (11.9) 52 (88.1)
Sex 0.488 0.022 0.007 0.005
 Male (n = 105, 35.2%) 36 (34.3) 69 (65.7) 80 (76.2) 25 (23.8) 60 (57.1) 45 (42.9) 34 (32.4) 71 (67.6)
 Female (n = 193, 64.8%) 74 (38.3) 119 (61.7) 122 (63.2) 71 (36.8) 79 (40.9) 114 (59.1) 35 (18.1) 158 (81.9)
BCG vaccination 0.456 0.004 0.020 0.008
 Yes (n = 250, 83.9%) 90 (36.0) 160 (64.0) 178 (71.2) 72 (28.8) 124 (49.6) 126 (50.4) 65 (26.0) 185 (74.0)
 No (n = 48, 16.1%) 20 (41.7) 28 (58.3) 24 (50.0) 24 (50.0) 15 (31.3) 33 (68.8) 4 (8.3) 44 (91.7)
Relationship 0.029 0.496 0.356 0.945
 Spouse (n = 122, 40.9%) 54 (44.3) 68 (55.7) 80 (65.6) 42 (34.4) 53 (43.4) 69 (56.6) 28 (23.0) 94 (77.0)
 Not spouse (n = 176, 59.1%) 56 (31.8%) 120 (68.2) 122 (69.3) 54 (30.7) 86 (48.9) 90 (51.1) 41 (23.3) 135 (76.7)
Time interval from TB diagnosis to LTBI screening, day 0.047 0.723 0.290 0.391
 < 30 70 (34.8) 131 (65.2) 135 (67.2) 66 (32.8) 90 (44.8) 111 (55.2) 45 (22.4) 156 (77.6)
 31–60 17 (31.5) 37 (68.5) 37 (68.5) 17 (31.5) 26 (48.1) 28 (51.9) 11 (20.4) 43 (79.6)
 > 60 (n = 43, 14.4%) 23 (53.5) 20 (46.5) 30 (69.8) 13 (30.2) 23 (53.5) 20 (46.5) 13 (30.2) 30 (69.8)
Previous TB history 0.372 0.430 0.124 0.222
 TB history (n = 17, 5.7%) 8 (47.1) 9 (52.9) 13 (76.5) 4 (23.5) 11 (64.7) 6 (35.3) 6 (35.3) 11 (64.7)
 No TB history (n = 281, 94.3%) 102 (36.3) 179 (63.7) 189 (67.3) 92 (32.7) 128 (45.6) 153 (54.4) 63 (22.4) 218 (77.6)
Positivity of AFB staining 0.030 0.740 0.919 0.798
 Positive (n = 117, 39.3%) 52 (44.4) 65 (55.6) 124 (68.5) 57 (31.5) 55 (47.0) 62 (53.0) 28 (23.9) 89 (76.1)
 Negative (n = 181, 60.7%) 58 (32.0) 123 (68.0) 78 (66.7) 39 (33.3) 84 (46.4) 97 (53.6) 41 (22.7) 140 (77.3)
Cough 0.079 0.282 0.735 0.323
 Yes (n = 160, 53.7%) 66 (41.3) 94 (58.8) 104 (65.0) 56 (35.0) 76 (47.5) 84 (52.5) 40 (25.0) 120 (75.0)
 No (n = 134, 45.6%) 42 (31.3) 92 (68.7) 95 (70.9) 39 (29.1) 61 (45.5) 73 (54.5) 27 (20.1) 107 (79.9)
Cavity on CT 0.076 0.007 0.002 0.199
 Yes (n = 109, 36.6%) 47 (43.1) 62 (56.9) 84 (77.1) 25 (22.9) 63 (57.8) 46 (42.2) 30 (27.5) 79 (72.5)
 No (n = 186, 63.1%) 61 (32.8) 125 (67.2) 115 (61.8) 71 (38.2) 73 (39.2) 113 (60.8) 39 (21.0) 147 (79.0)

Values are presented as number (%).

TST, tuberculin skin test; BCG, Bacille Calmette-Guerin; TB, tuberculosis; LTBI, latent tuberculosis infection; AFB, acid-fast bacillus; CT, computed tomography.

Table 5.
Multiple logistic regression analysis of T-SPOT.TB with associated factors for test positivity
Variable T-SPOT.TB positive
OR 95% CI p value
Age < 35 yr 0.206 0.094–0.451 < 0.001
Male sex 1.054 0.620–1.792 0.845
Spouse 1.850 1.112–3.079 0.018
Time interval from TB diagnosis to LTBI screening > 60 days 2.602 1.309–5.172 0.006
Positivity of AFB staining 1.697 1.050–2,742 0.031
Cavity on chest CT 1.368 0.801–2.337 0.251
Previous TB history 2.165 0.774–6.049 0.141

TST, tuberculin skin test; OR, odds ratio; CI, confidence interval; TB, tuberculosis; LTBI, latent tuberculosis infection; AFB, acid-fast bacillus; CT, computed tomography.

Table 6.
Multiple logistic regression analysis of TST with associated factors for test positivity
Variable TST > 5 mm
TST > 10 mm
TST > 15 mm
OR 95% CI p value OR 95% CI p value OR 95% CI p value
Age < 35 yr 0.683 0.369–1.264 0.225 0.620 0.343–1.119 0.112 0.577 0.283–1.173 0.129
Male sex 1.885 1.067–3.329 0.029 1.948 1.161–3.269 0.012 2.511 1.390–4.537 0.002
BCG 2.522 1.289–4.934 0.007 2.102 1.048–4.214 0.036 4.359 1.463–12.989 0.008
Spouse 0.968 0.559–1.674 0.906 0.861 0.513–1.447 0.573 1.210 0.663–2.209 0.534
Time interval from TB diagnosis to LTBI screening > 60 days 1.217 0.585–2.533 0.599 1.587 0.806–3.127 0.182 1.772 0.833–3.770 0.137
Positivity of AFB staining 1.645 0.934–2.897 0.085 1.465 0.856–2.507 0.164 1.019 0.552–1.883 0.952
Cavity on chest CT 2.341 1.295–4.231 0.005 2.358 1.378–4.036 0.002 1.283 0.696–2.366 0.425

TST, tuberculin skin test; OR, odds ratio; CI, confidence interval; BCG, Bacille Calmette-Guerin; TB, tuberculosis; LTBI, latent tuberculosis infection; AFB, acid-fast bacillus; CT, computed tomography.

REFERENCES

1. Centers for Disease Control and Prevention. Latent Tuberculosis Infection: A Guide for Primary Health Care Providers. Atlanta: Centers for Disease Control and Prevention, 2013.

2. Horsburgh CR Jr, Rubin EJ. Clinical practice: latent tuberculosis infection in the United States. N Engl J Med 2011;364:1441–1448.
crossref pmid
3. Weyer K, Gilpin C, Mirzayev F, van Gemert W, World Health Organization. Use of tuberculosis interferon-gamma release assays (IGRAs) in low- and middle-income countries: policy statement. Geneva: World Health Organization, 2011.

4. The Korean Pediatric Society. Immunization Guideline. 7th ed. Seoul: The Korean Pediatric Society, 2012.

5. Kimura M, Converse PJ, Astemborski J, et al. Comparison between a whole blood interferon-gamma release assay and tuberculin skin testing for the detection of tuberculosis infection among patients at risk for tuberculosis exposure. J Infect Dis 1999;179:1297–1300.
crossref pmid pdf
6. Pai M, Zwerling A, Menzies D. Systematic review: T-cell-based assays for the diagnosis of latent tuberculosis infection: an update. Ann Intern Med 2008;149:177–184.
crossref pmid pmc
7. Kang YA, Lee HW, Yoon HI, et al. Discrepancy between the tuberculin skin test and the whole-blood interferon gamma assay for the diagnosis of latent tuberculosis infection in an intermediate tuberculosis-burden country. JAMA 2005;293:2756–2761.
crossref pmid
8. Wang L, Turner MO, Elwood RK, Schulzer M, FitzGerald JM. A meta-analysis of the effect of Bacille Calmette Guérin vaccination on tuberculin skin test measurements. Thorax 2002;57:804–809.
crossref pmid pmc
9. Royal College of Physicians of London; National Clinical Guideline Centre for Acute and Chronic Conditions (Great Britain); Centre for Clinical Practice (National Institute for Health and Clinical Excellence) (Great Britain). Tuberculosis: Clinical Diagnosis and Management of Tuberculosis, and Measures for Its Prevention and Control. London: Royal College of Physicians, 2011.

10. European Centre for Disease Prevention and Control. Use of Interferon-Gamma Release Assays in Support of TB Diagnosis. Stockholm: ECDC, 2011.

11. Lee SJ, Lee SH, Kim YE, et al. Risk factors for latent tuberculosis infection in close contacts of active tuberculosis patients in South Korea: a prospective cohort study. BMC Infect Dis 2014;14:566.
crossref pmid pmc pdf
12. Shakak AO, Khalil EA, Musa AM, et al. Prevalence of latent tuberculosis infection in Sudan: a case-control study comparing interferon-γ release assay and tuberculin skin test. BMC Public Health 2013;13:1128.
crossref pmid pmc
13. Brodie D, Lederer DJ, Gallardo JS, Trivedi SH, Burzynski JN, Schluger NW. Use of an interferon-gamma release assay to diagnose latent tuberculosis infection in foreign-born patients. Chest 2008;133:869–874.
crossref pmid
14. Kent PT, Kubica GP, Centers for Disease Control (US). Public Health Mycobacteriology: A Guide for the Level III Laboratory. Atlanta: Centers for Disease Control, 1985.

15. van Zyl-Smit RN, Pai M, Peprah K, et al. Within-subject variability and boosting of T-cell interferon-gamma responses after tuberculin skin testing. Am J Respir Crit Care Med 2009;180:49–58.
crossref pmid
16. Vilaplana C, Ruiz-Manzano J, Gil O, et al. The tuberculin skin test increases the responses measured by T cell interferon-gamma release assays. Scand J Immunol 2008;67:610–617.
crossref pmid
17. van Zyl-Smit RN, Zwerling A, Dheda K, Pai M. Within-subject variability of interferon-g assay results for tuberculosis and boosting effect of tuberculin skin testing: a systematic review. PLoS One 2009;4:e8517.
crossref pmid pmc
18. Bienek DR, Chang CK. Evaluation of an interferon-gamma release assay, T-SPOT.TB, in a population with a low prevalence of tuberculosis. Int J Tuberc Lung Dis 2009;13:1416–1421.
pmid
19. Brock I, Weldingh K, Lillebaek T, Follmann F, Andersen P. Comparison of tuberculin skin test and new specific blood test in tuberculosis contacts. Am J Respir Crit Care Med 2004;170:65–69.
crossref pmid
20. Ewer K, Deeks J, Alvarez L, et al. Comparison of T-cell-based assay with tuberculin skin test for diagnosis of Mycobacterium tuberculosis infection in a school tuberculosis outbreak. Lancet 2003;361:1168–1173.
crossref pmid
21. Diel R, Loddenkemper R, Niemann S, Meywald-Walter K, Nienhaus A. Negative and positive predictive value of a whole-blood interferon-γ release assay for developing active tuberculosis: an update. Am J Respir Crit Care Med 2011;183:88–95.
crossref pmid
22. Arend SM, Thijsen SF, Leyten EM, et al. Comparison of two interferon-gamma assays and tuberculin skin test for tracing tuberculosis contacts. Am J Respir Crit Care Med 2007;175:618–627.
crossref pmid
23. Song SE, Yang J, Lee KS, et al. Comparison of the tuberculin skin test and interferon gamma release assay for the screening of tuberculosis in adolescents in close contact with tuberculosis TB patients. PLoS One 2014;9:e100267.
crossref pmid pmc
24. Diel R, Loddenkemper R, Meywald-Walter K, Niemann S, Nienhaus A. Predictive value of a whole blood IFN-gamma assay for the development of active tuberculosis disease after recent infection with Mycobacterium tuberculosis. Am J Respir Crit Care Med 2008;177:1164–1170.
crossref pmid
25. Farhat M, Greenaway C, Pai M, Menzies D. False-positive tuberculin skin tests: what is the absolute effect of BCG and non-tuberculous mycobacteria? Int J Tuberc Lung Dis 2006;10:1192–1204.
pmid
26. Pareek M, Bond M, Shorey J, et al. Community-based evaluation of immigrant tuberculosis screening using interferon γ release assays and tuberculin skin testing: observational study and economic analysis. Thorax 2013;68:230–239.
crossref pmid pmc
27. Shanaube K, Hargreaves J, Fielding K, et al. Risk factors associated with positive QuantiFERON-TB Gold In-Tube and tuberculin skin tests results in Zambia and South Africa. PLoS One 2011;6:e18206.
crossref pmid pmc
28. Li J, Munsiff SS, Agerton TB. Prevalence of tuberculin skin test positivity in clinical population in New York City. J Immigr Minor Health 2010;12:816–822.
crossref pmid
29. Critselis E, Amanatidou V, Syridou G, et al. The effect of age on whole blood interferon-gamma release assay response among children investigated for latent tuberculosis infection. J Pediatr 2012;161:632–638.
crossref pmid
30. Anuradha B, Santosh CM, Hari Sai Priya V, et al. Age-related waning of in vitro interferon-gamma levels against r32kDaBCG in BCG vaccinated children. J Immune Based Ther Vaccines 2007;5:8.
crossref pmid pmc
31. Ors F, Deniz O, Bozlar U, et al. High-resolution CT findings in patients with pulmonary tuberculosis: correlation with the degree of smear positivity. J Thorac Imaging 2007;22:154–159.
crossref pmid
32. Garfein RS, Laniado-Laborin R, Rodwell TC, et al. Latent tuberculosis among persons at risk for infection with HIV, Tijuana, Mexico. Emerg Infect Dis 2010;16:757–763.
crossref pmid pmc
33. Ting WY, Huang SF, Lee MC, et al. Gender disparities in latent tuberculosis infection in high-risk individuals: a cross-sectional study. PLoS One 2014;9:e110104.
crossref pmid pmc

Editorial Office
101-2501, Lotte Castle President, 109 Mapo-daero, Mapo-gu, Seoul 04146, Korea
Tel: +82-2-2271-6792    Fax: +82-2-790-0993    E-mail: kaim@kams.or.kr                

Copyright © 2024 by Korean Association of Internal Medicine.

Close layer
prev next